VAST Challenge 2020
Mini-Challenge 2
Team Members:
Huyen N. Nguyen1, IDV Lab, Texas Tech University, huyen.nguyen@ttu.edu PRIMARYJake Gonzalez1, IDV Lab, Texas Tech University, jake.gonzalez@ttu.edu
Jian Guo, IDV Lab, Texas Tech University, jian.guo@ttu.edu
Ngan V.T. Nguyen, IDV Lab, Texas Tech University, ngan.v.t.nguyen@ttu.edu
Tommy Dang, IDV Lab, Texas Tech University, tommy.dang@ttu.edu
Student Team: YES
Tools Used:
HTML, CSS, JavaScriptD3.js
Demos: https://huyen-nguyen.github.io/VAST2020mc2/
Release
v1.0 https://github.com/huyen-nguyen/VAST2020mc2/releases/tag/v1.0Approximately how many hours were spent working on this submission in total?
320 hours.May we post your submission in the Visual Analytics Benchmark Repository after VAST Challenge 2020 is complete? YES
Video
https://huyen-nguyen.github.io/VAST2020mc2/PDF of entry form:
Due to size limit, the PDF form is included in the release and can be found at https://github.com/huyen-nguyen/VAST2020mc2/blob/master/pdfForm/TTU-Nguyen-MC2.pdf1Huyen N. Nguyen and Jake Gonzalez contributed equally to this work.
Questions
1.1. Examine the classifier from the classifier results provided
There are total 43 classes in the training set; in the classifier results there are only 22 classes detected. There is no detection for any of the remaining classes.
Figure 1 shows the summary of 4491 detected objects found (in red), classified in only 22 classes. However, the number of true objects (1370) is less than 1/3 of detected objects and distributed quite evenly among all 43 classes. The number of true detections is higher on the right side (in green): 731/1370 = 53%. That means the machine learning model missed out at least 53% of the objects, hence not a good model.

Figure 1. Distribution overview
In Figure 2, we put all images, objects, and persons in the forced-directed layout where persons connect to all of their images and images connect to their objects. We can easily notice the 21 objects which are not labeled in the challenge data.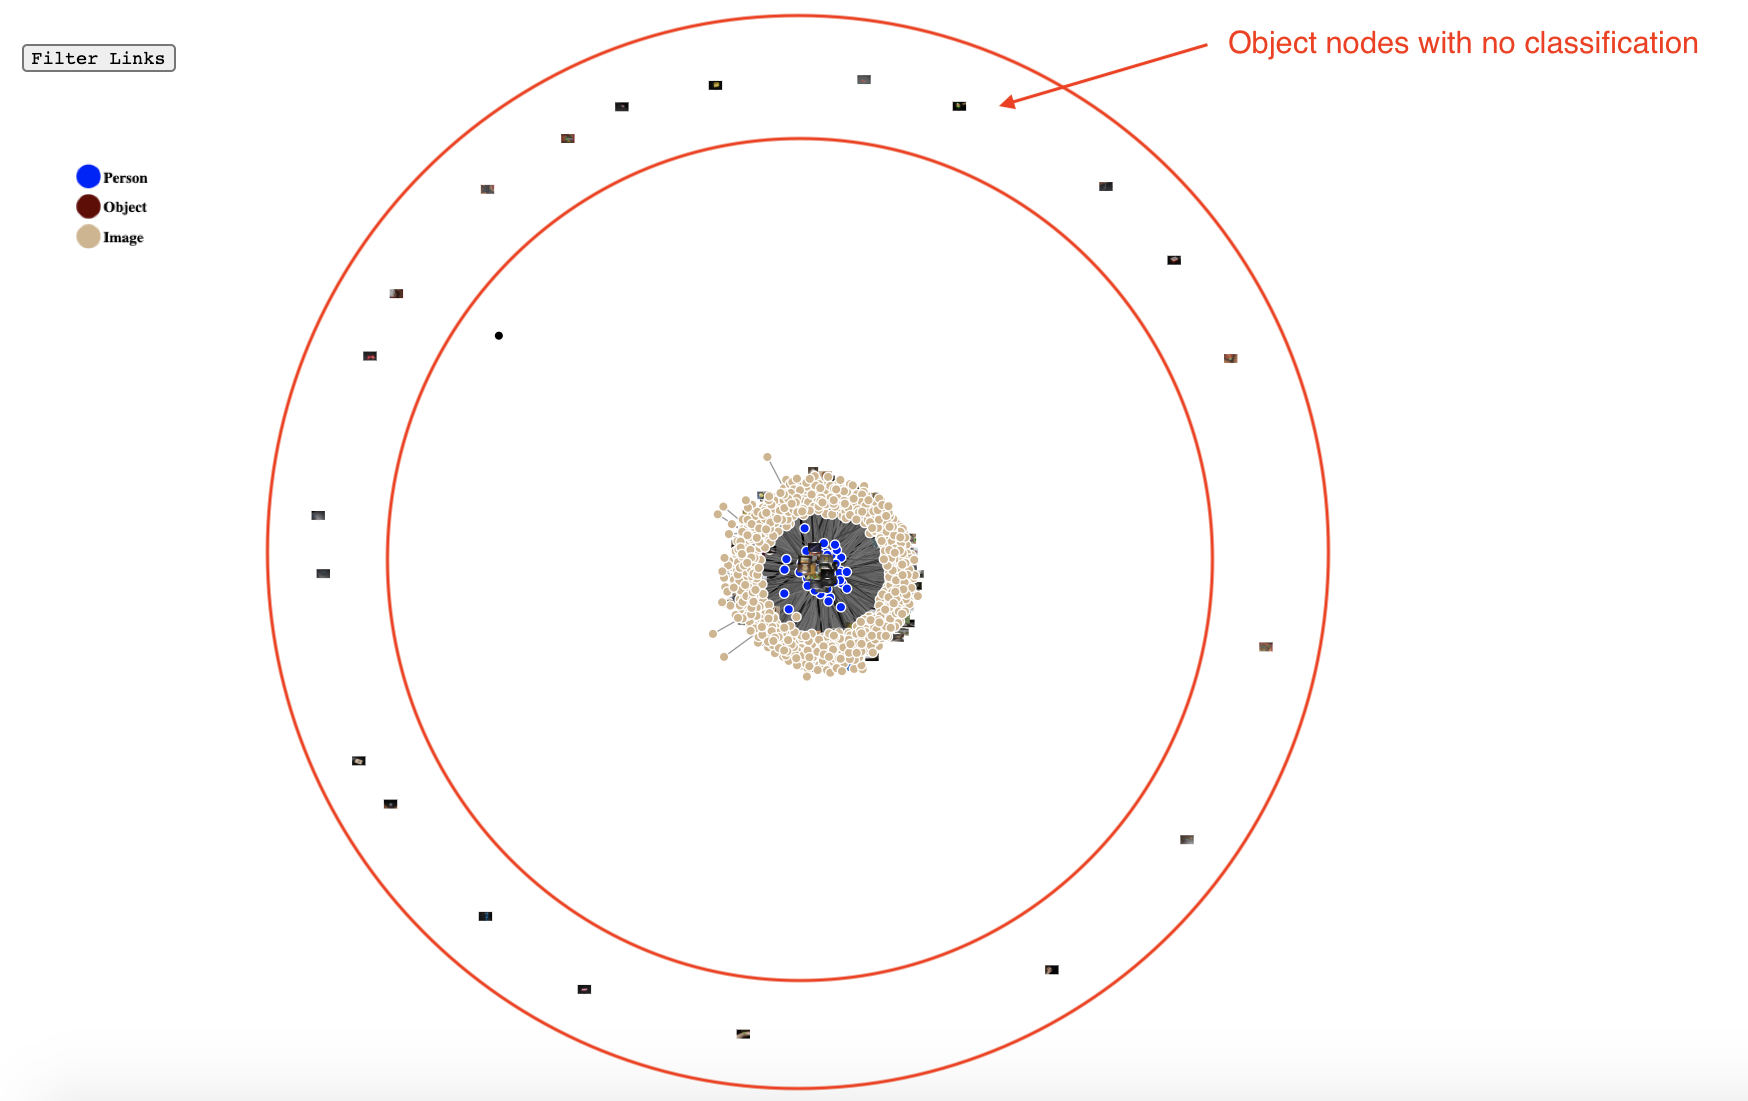
Figure 2. Objects not classified in original data.
1.2. Which objects classified well and which more poorly by the machine learning algorithm?
We use Average Precision (AP) — precision averaged across all recall values, to evaluate the performance for each classifier. Then we compare AP between different object detectors to rank them. By interpolating all points, AP can be interpreted as an approximated area under the curve (AUC) of the Precision x Recall curve (PASCAL VOC challenge). A higher value means higher accuracy on detection.
The process for getting AP is demonstrated in Figure 3: As user marks TP/FP, the table and Precision-Recall curve automatically update, calculate the AUC to approximate AP.
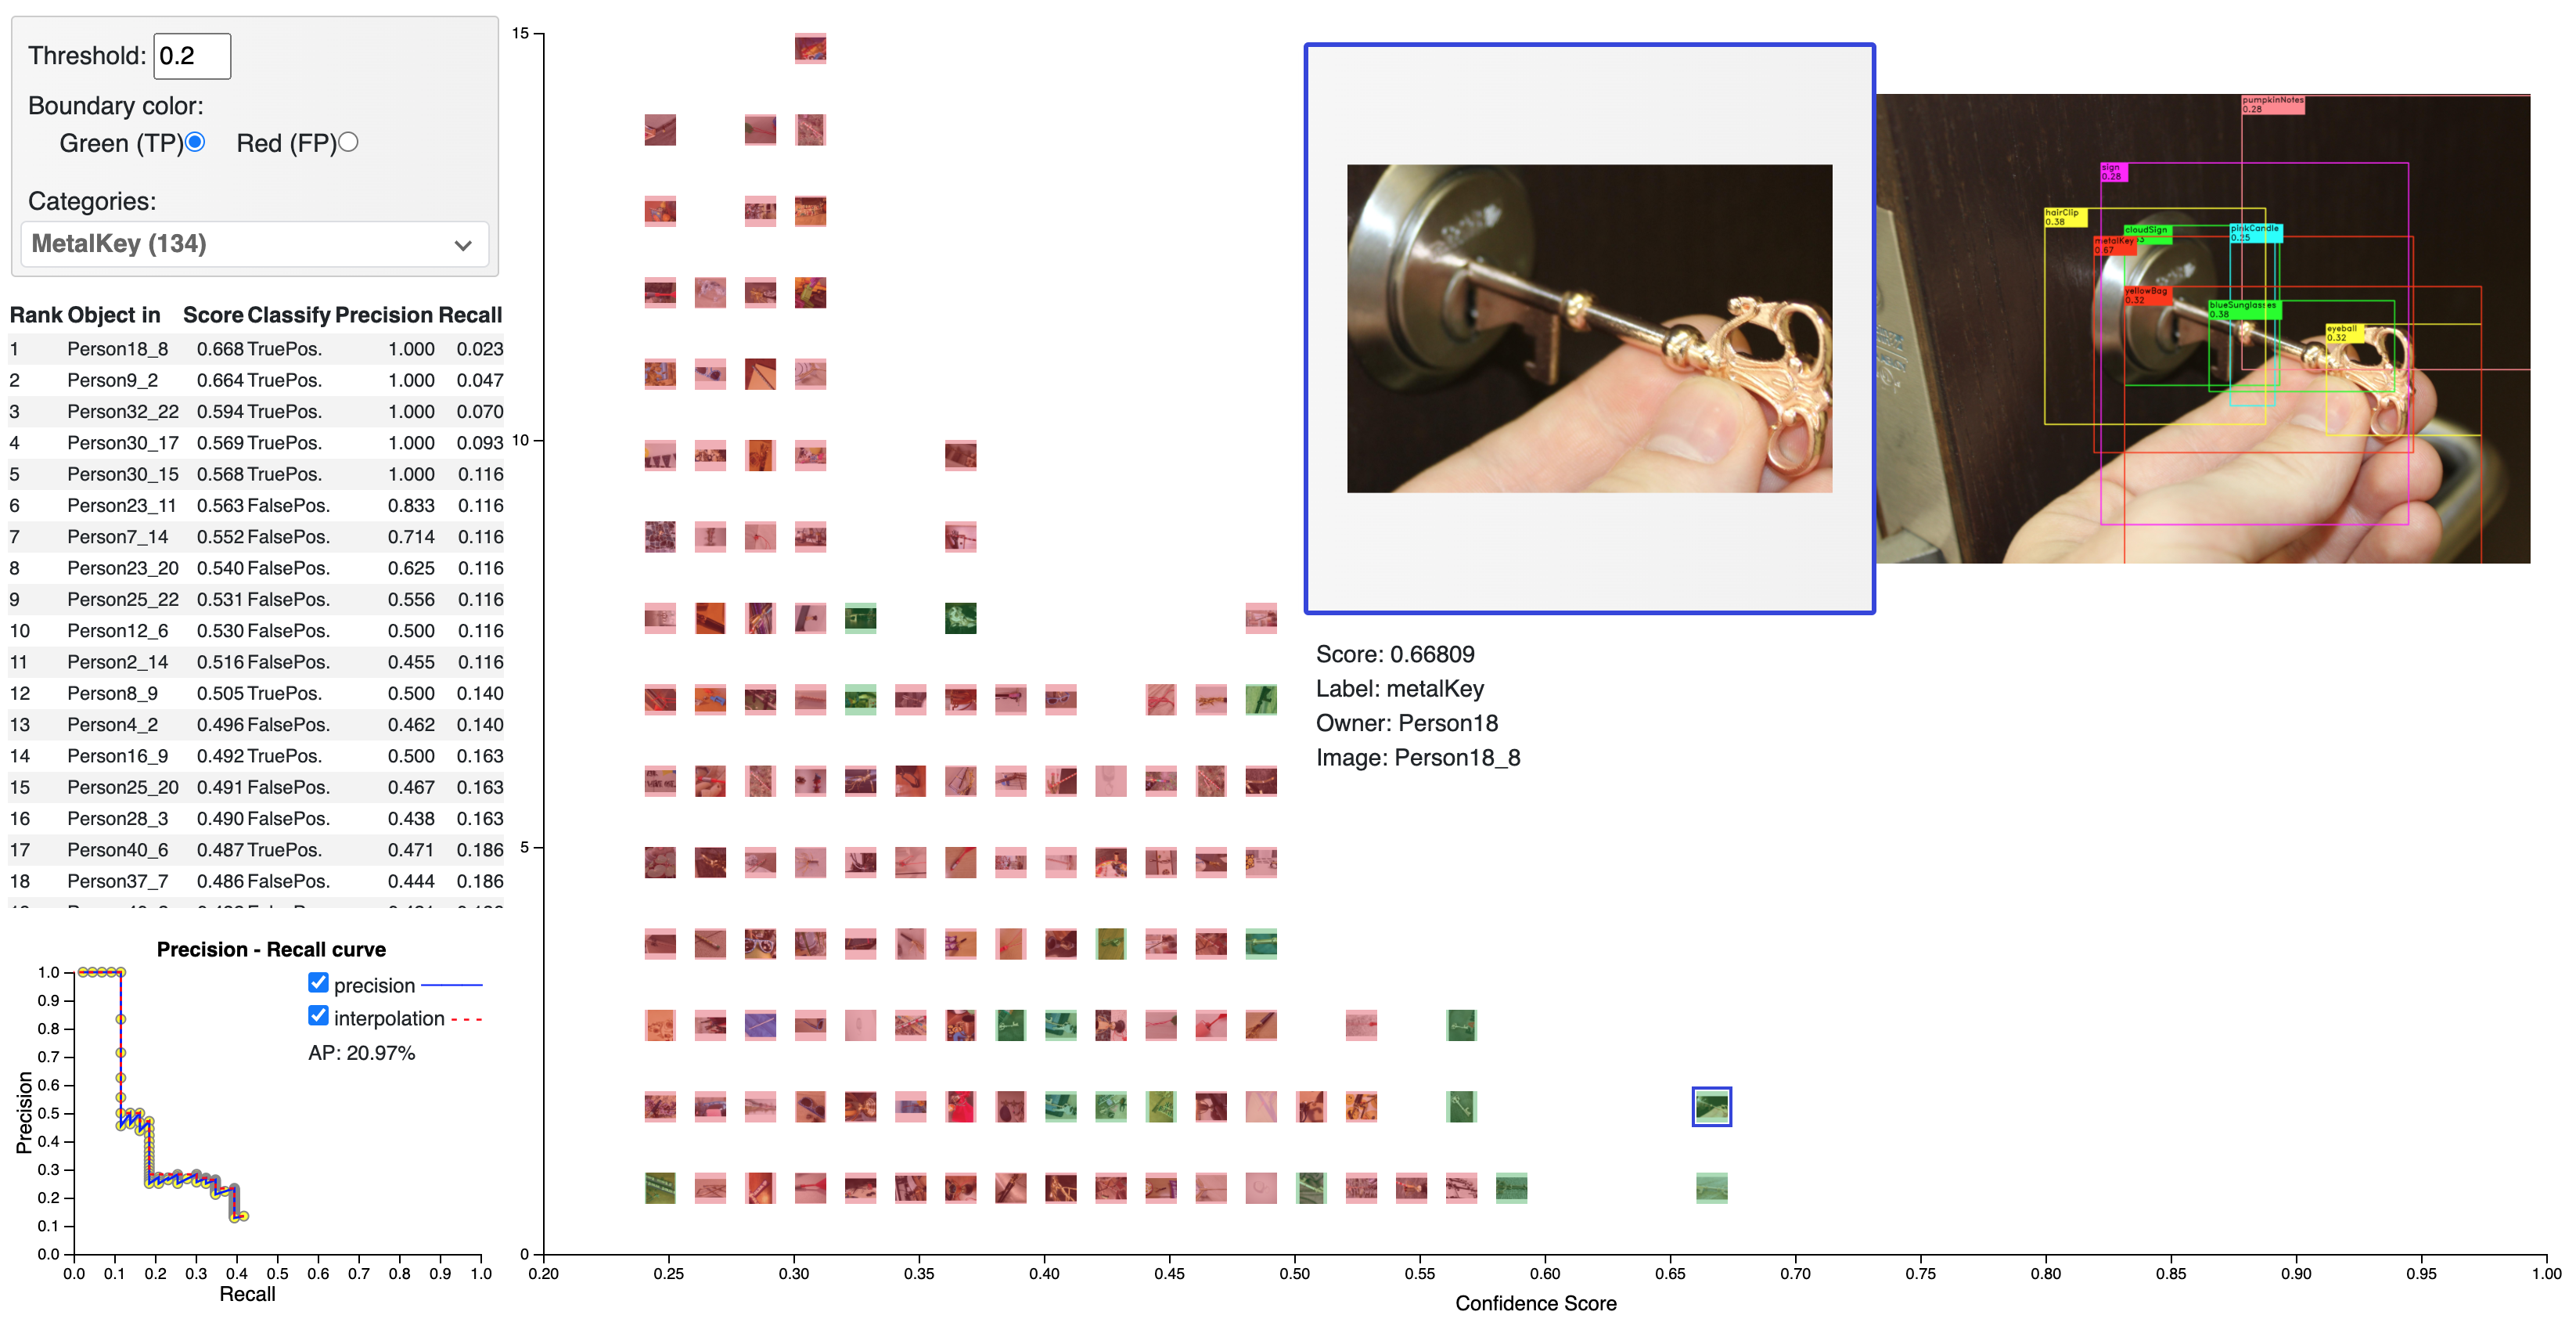
Figure 3: Process of getting AP for each class.
The classifiers that cannot detect objects (23 → 43 in Fig. 1): Zero detectionsFor each of the 21 classes with zero detections:
- True Positive = 0, False Positive = 0
- False Negative ≥ 1
Hence, Precision = 0 and Recall = 0, AP = 0: These objects classified poorly.
We consider the penalty for classifier that missed out more objects: From Figure 1, rainbowPens missed out the biggest number of objects (86) — that is the worst classifier.
Ranking from best to worst classifier
We first rank by AP; for the poorer classifiers, we rank by penalty on number of missing objects.
Figure 4: Ranking classifiers from best to worst.
As shown in Figure 5, the sign was one of the objects with the highest number of classifications. however, it had 1/9 correct classification at a confidence score of at least 0.7.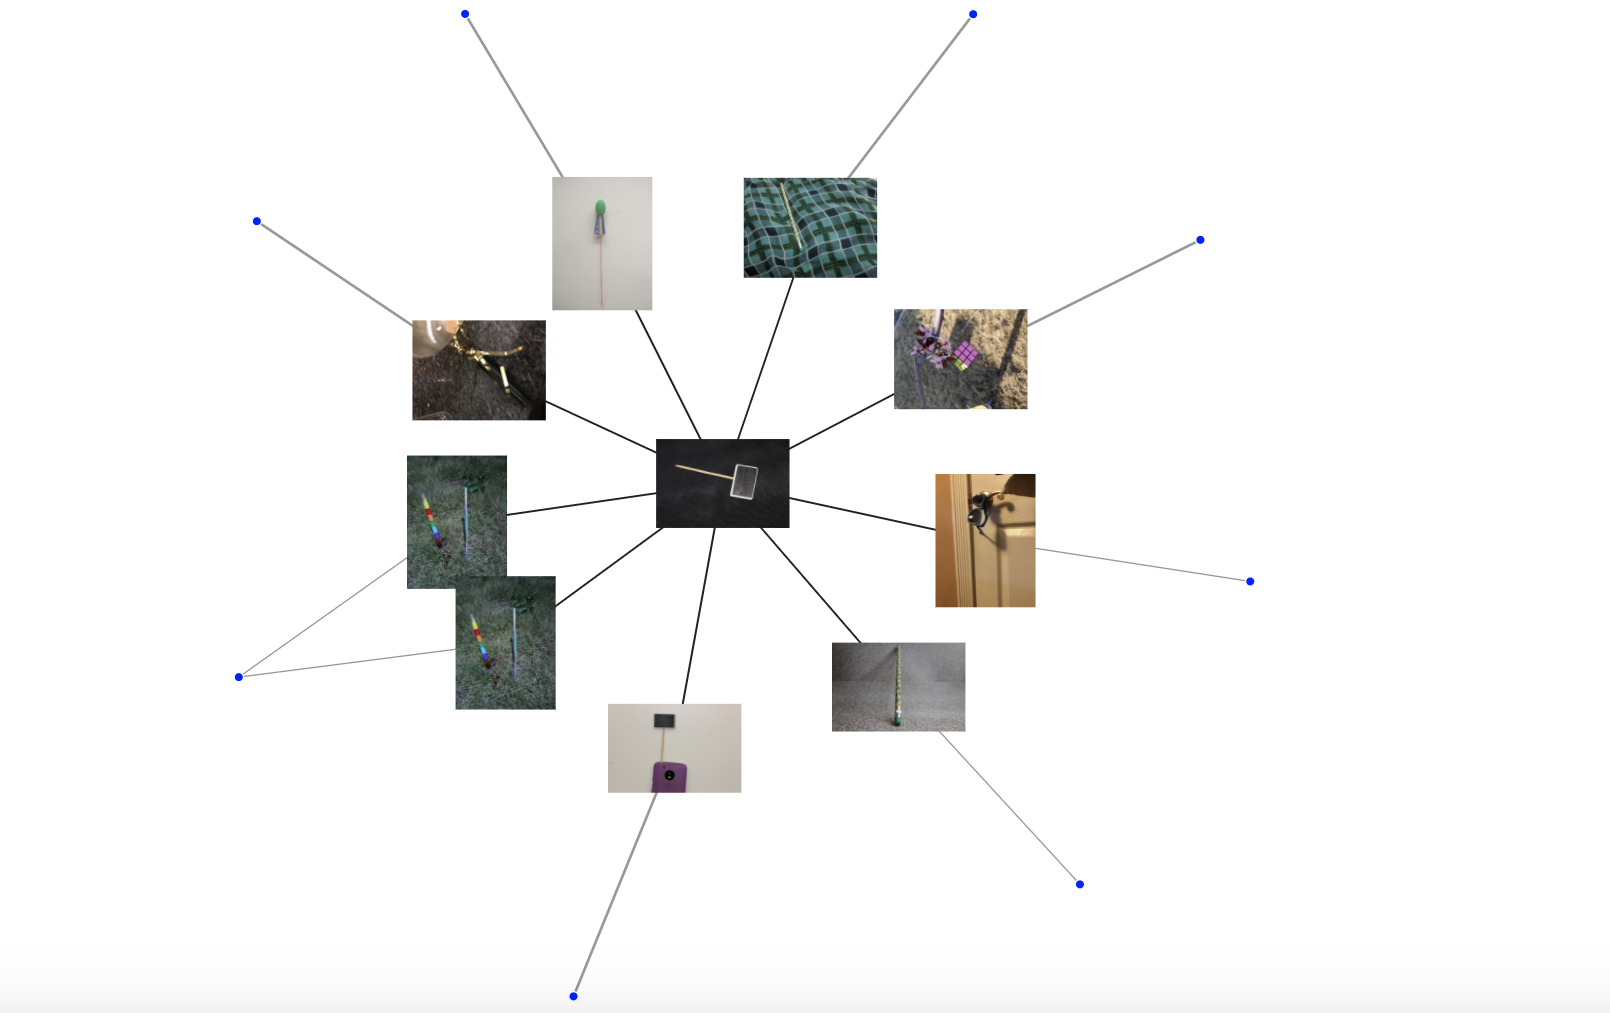
Figure 5: Sign detections with confidence ≥ 0.7
2.1. Demonstrate the process for correcting classification errors using visual analytics.
Figure 6 describes the platform for correcting classification errors. The detected labels are listed and sorted by confidence scores.

Figure 6: Platform for correcting classification errors
Panel A: Image list in descending order. User can select Person from the dropdown list.
Panel B: Label list, divided in 2 sections. The Detected section includes all the detected labels from the prediction in image, sorted by confidence score. The Alternative section includes all the other labels, sorted (A-Z). The sorted order help users to select the desire labels fast. User can de-select if wrongly select labels.
Panel C: Image display frame. After selecting labels, user can press "Save" to update to the table in Panel D. This frame includes 2 modes for displaying images: Original and Annotated — with labels, bounding boxes and confidence score. This helps users easily see prediction on the image.
Panel D: Correction result. The result from "Save" action is updated on the table, sorted by Person and Image. For later use, users can Export the result to CSV format.
2.2. Represent confidence and uncertainty
From the model perspective:
The Detected panel B shows the confidence scores from the challenge. The manual correction gives the detection confidence score 1.
The uncertainty can come from the bounding boxes coordinates. As the bounding box coordinates may vary compared to the fit box around the object, we can visualize the bounding boxes with edges in an acceptable range. We evaluate the true positive/false positive by if the bounding box can capture the essence of the object. Figure 7 presents the uncertainty on bounding boxes.
From the human perspective:
Uncertainty can come from subjective assessment of user. If user is not sure about their correction for an example, user can mark "Difficult" on that image before "Save".
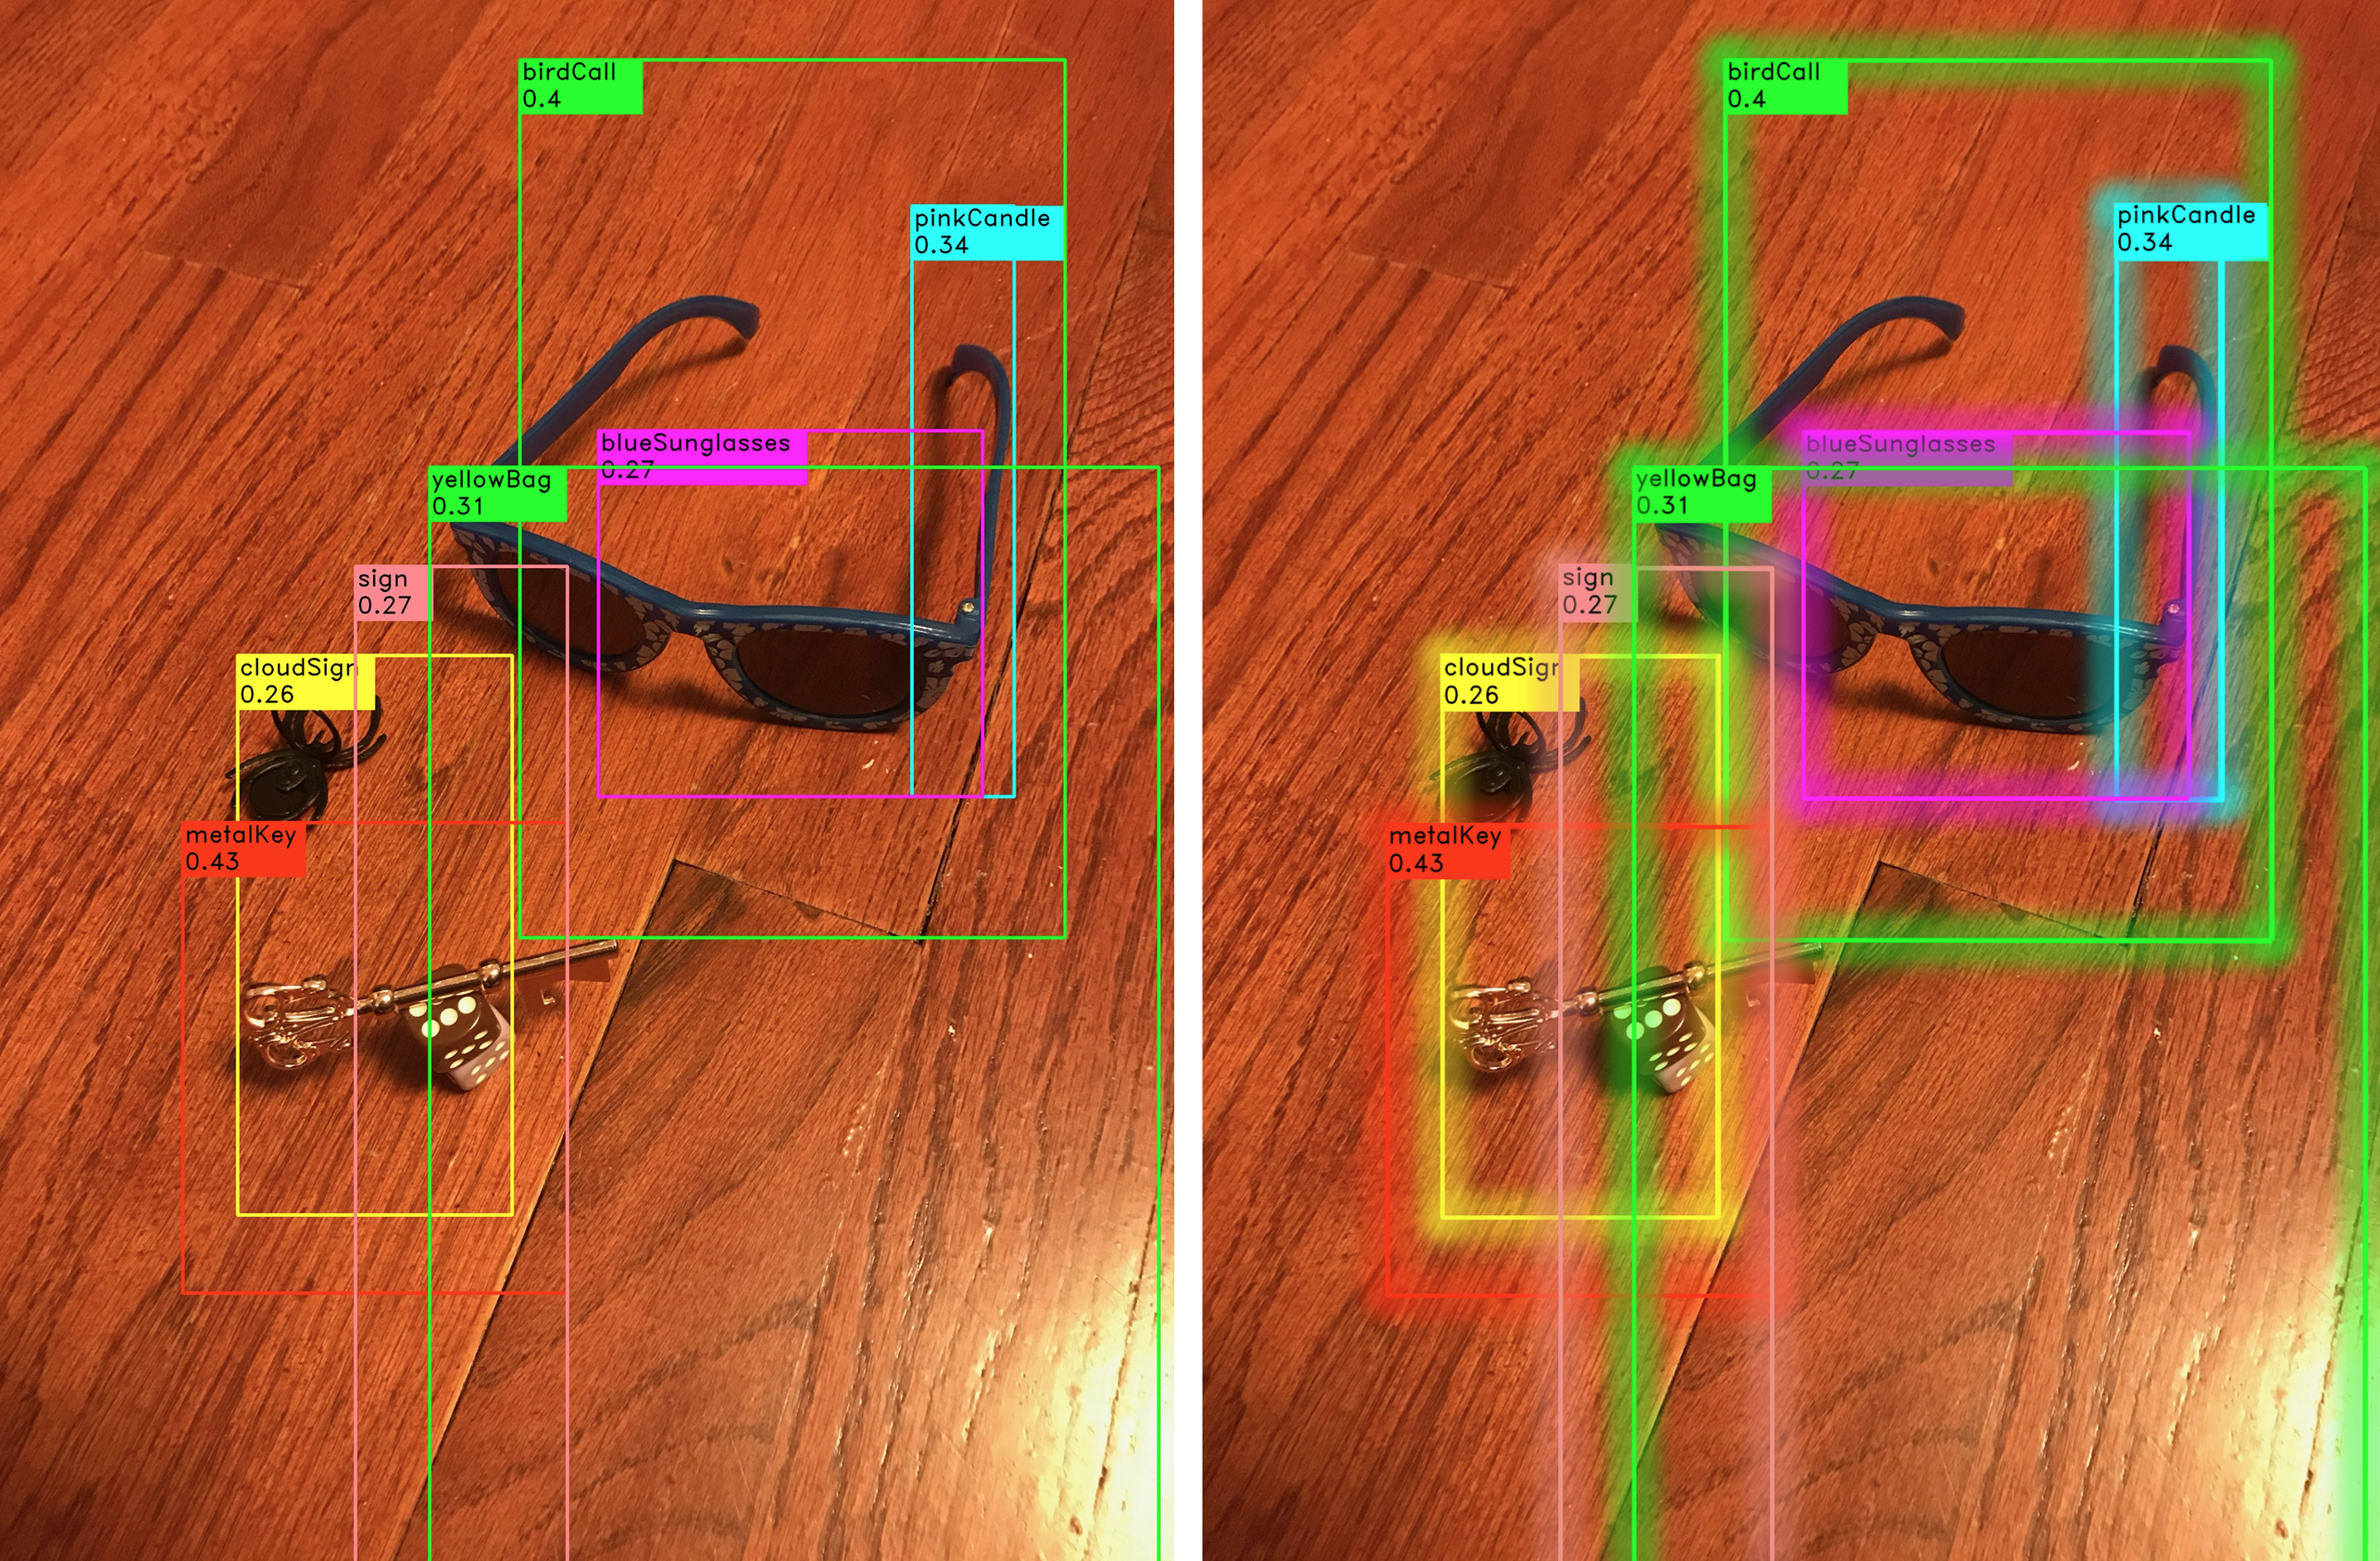
Figure 7
Figure 8 shows the overview of confidence scores per object vs. person, provided by the challenge. The blue violins show the summary distributions of confidence scores (from 0 to 1) for objects (rows) and persons (columns). In this matrix, rows and columns have ordered by the average confidence score (the black vertical bar inside the violins): highest confidence objects are listed first.
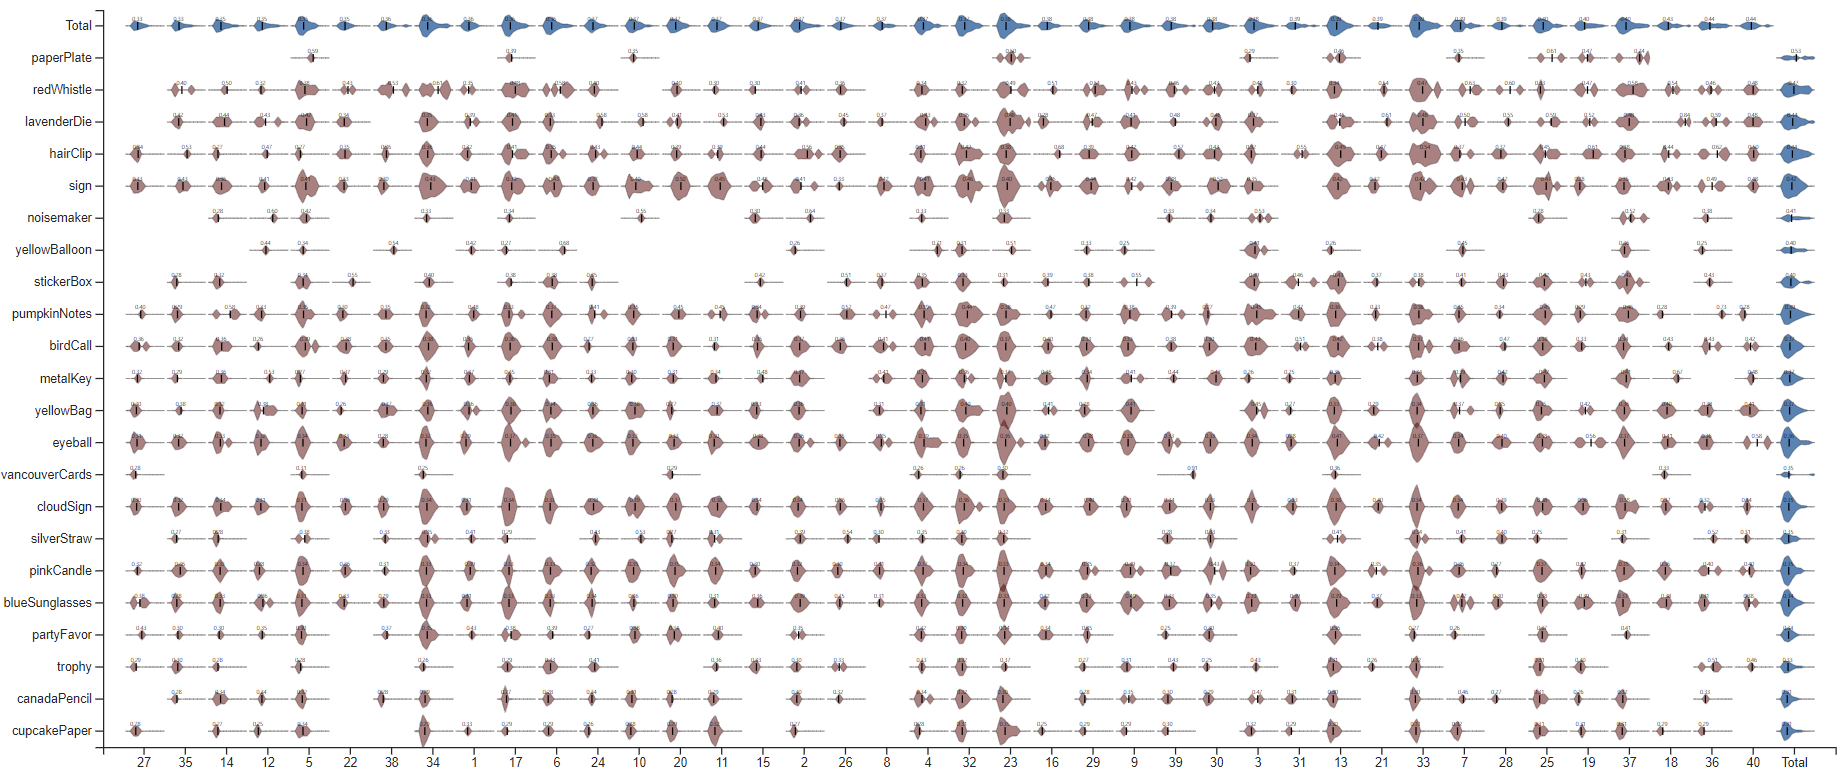
Figure 8
The next figure shows the updated matrix after the correction process. The true labels are highlighted in the green boxes: bigger boxes indicate more objects have been corrected into this classification. We notice that the all 21 zero classification objects (on the top) have received the correct classifications.
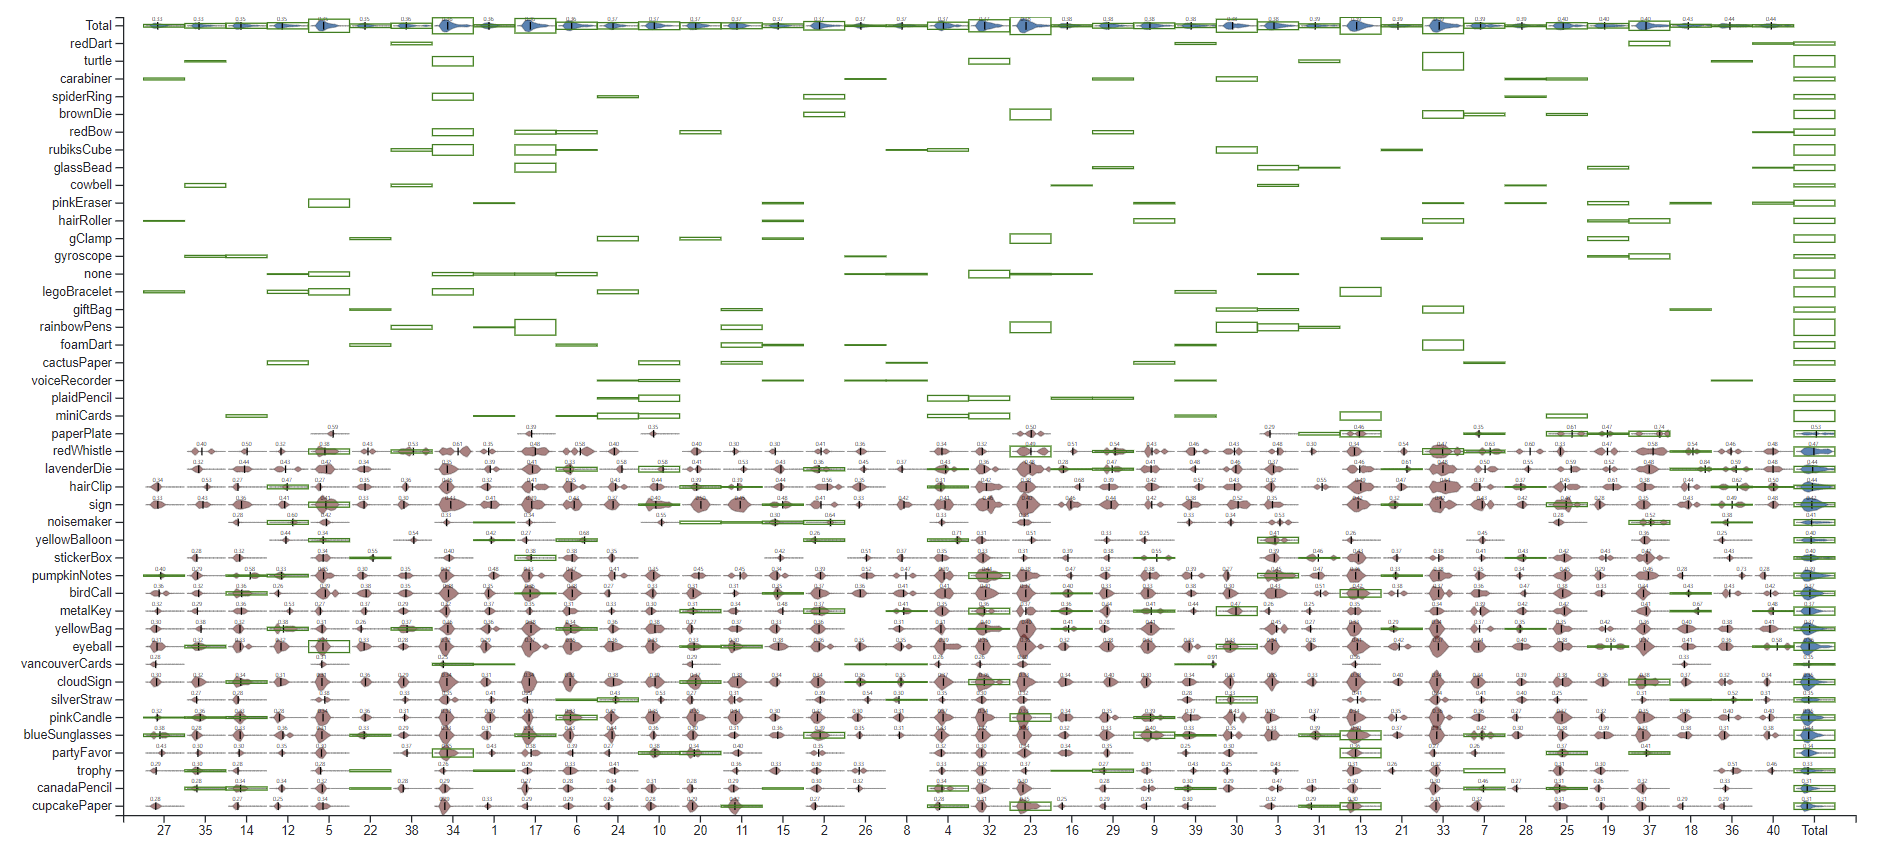
Figure 9
2.3. How could correction process be made more efficient?
The correction can be use to mark similar images at the same time when they have the same characteristic.
1) Occlusion: Figure below shows the occlusion in the detection result. The occlusion means that we may found these objects together, with one side the bounding box of the other. Having the detection in this manner can help users quickly identify two objects at a time.
There are 124 cases with the pinkCandle within the sign; however, there is no such case in the groundtruth. This may stem from the shape of the handle of the sign and the pinkCandle are lookalike.

Figure 10: Top 20 occlusion found in detection
2) Similarity in bounding boxes Intersection-over-Union (IoU)
Two images can be considered to have similar objects if they share a same set of detections which are highly overlapping. We chose threshold 0.5 for IoU. The figure below presents the top 12 common labels having overlapping with threshold 0.5, and corresponding 10 images for group pumpkinNotes_yellowBag_yellowBalloon. We can see that 6/10 images are about yellowBalloon. So if we correct 1 of them as yellowBalloon, there are 5 other images that can be automatically corrected right.
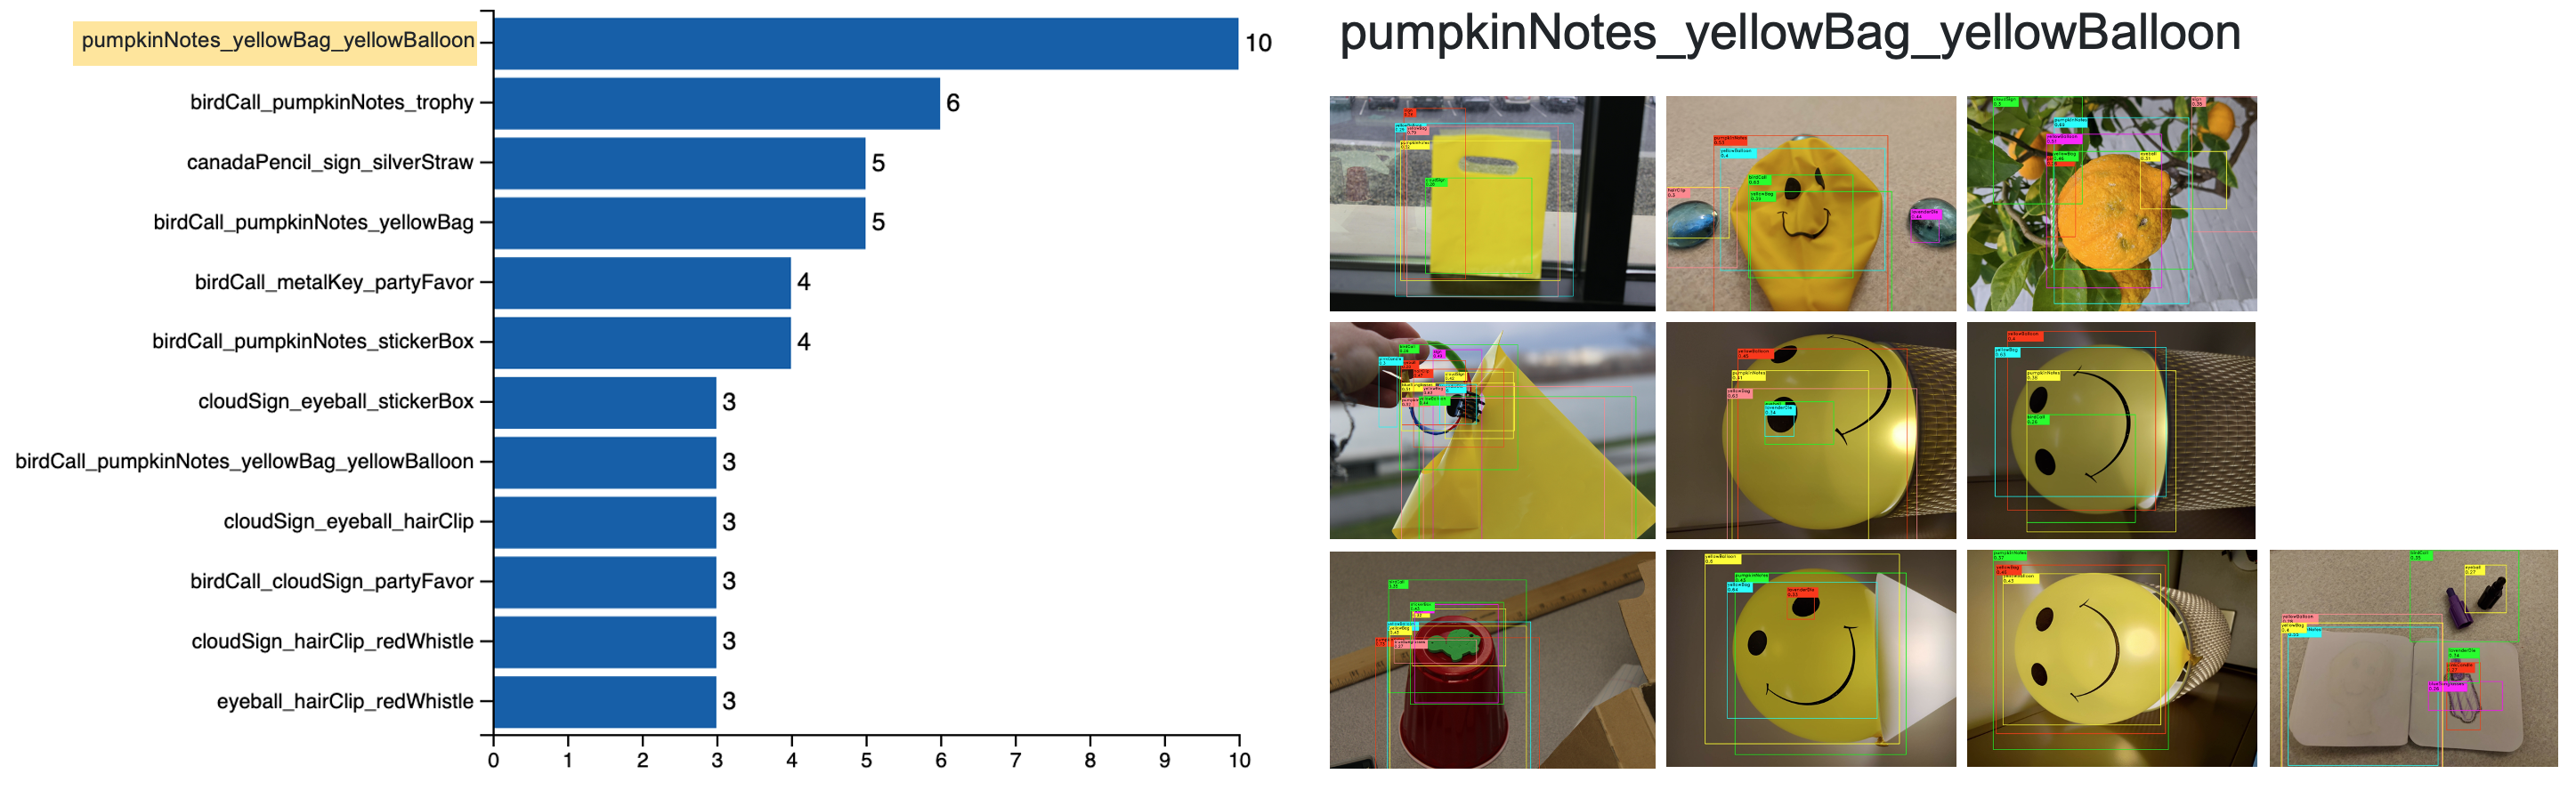
Figure 11: Top 12 common labels having IoU over 0.5 (left) and the corresponding 10 images for group pumpkinNotes_yellowBag_yellowBalloon: (not in order) Person32_49, Person3_2, Person3_19, Person3_18, Person3_20, Person3_15, Person3_17, Person36_3, Person23_64, Person12_12.
a. Which people have which objects? Please limit your answer to 8 images and 250 words
The following two networks show the distribution of objects across the 40 people using predicted data and ground truth data respectively.
For the network of predicted data on the left, the opacity of the links represents the mean confidence score of an object and the thickness of the links represent the total number of objects detected.
For the network of ground truth data on the right, the thickness of the links represents the total number of objects a person owns.

Figure 12: Left: network for predicted data; Right: network for ground truth data
Take person 17 as an example, by comparing the two networks we can see that this person is predicted to have 20 objects, while actually he/she has only 6 objects -- Figure 12.
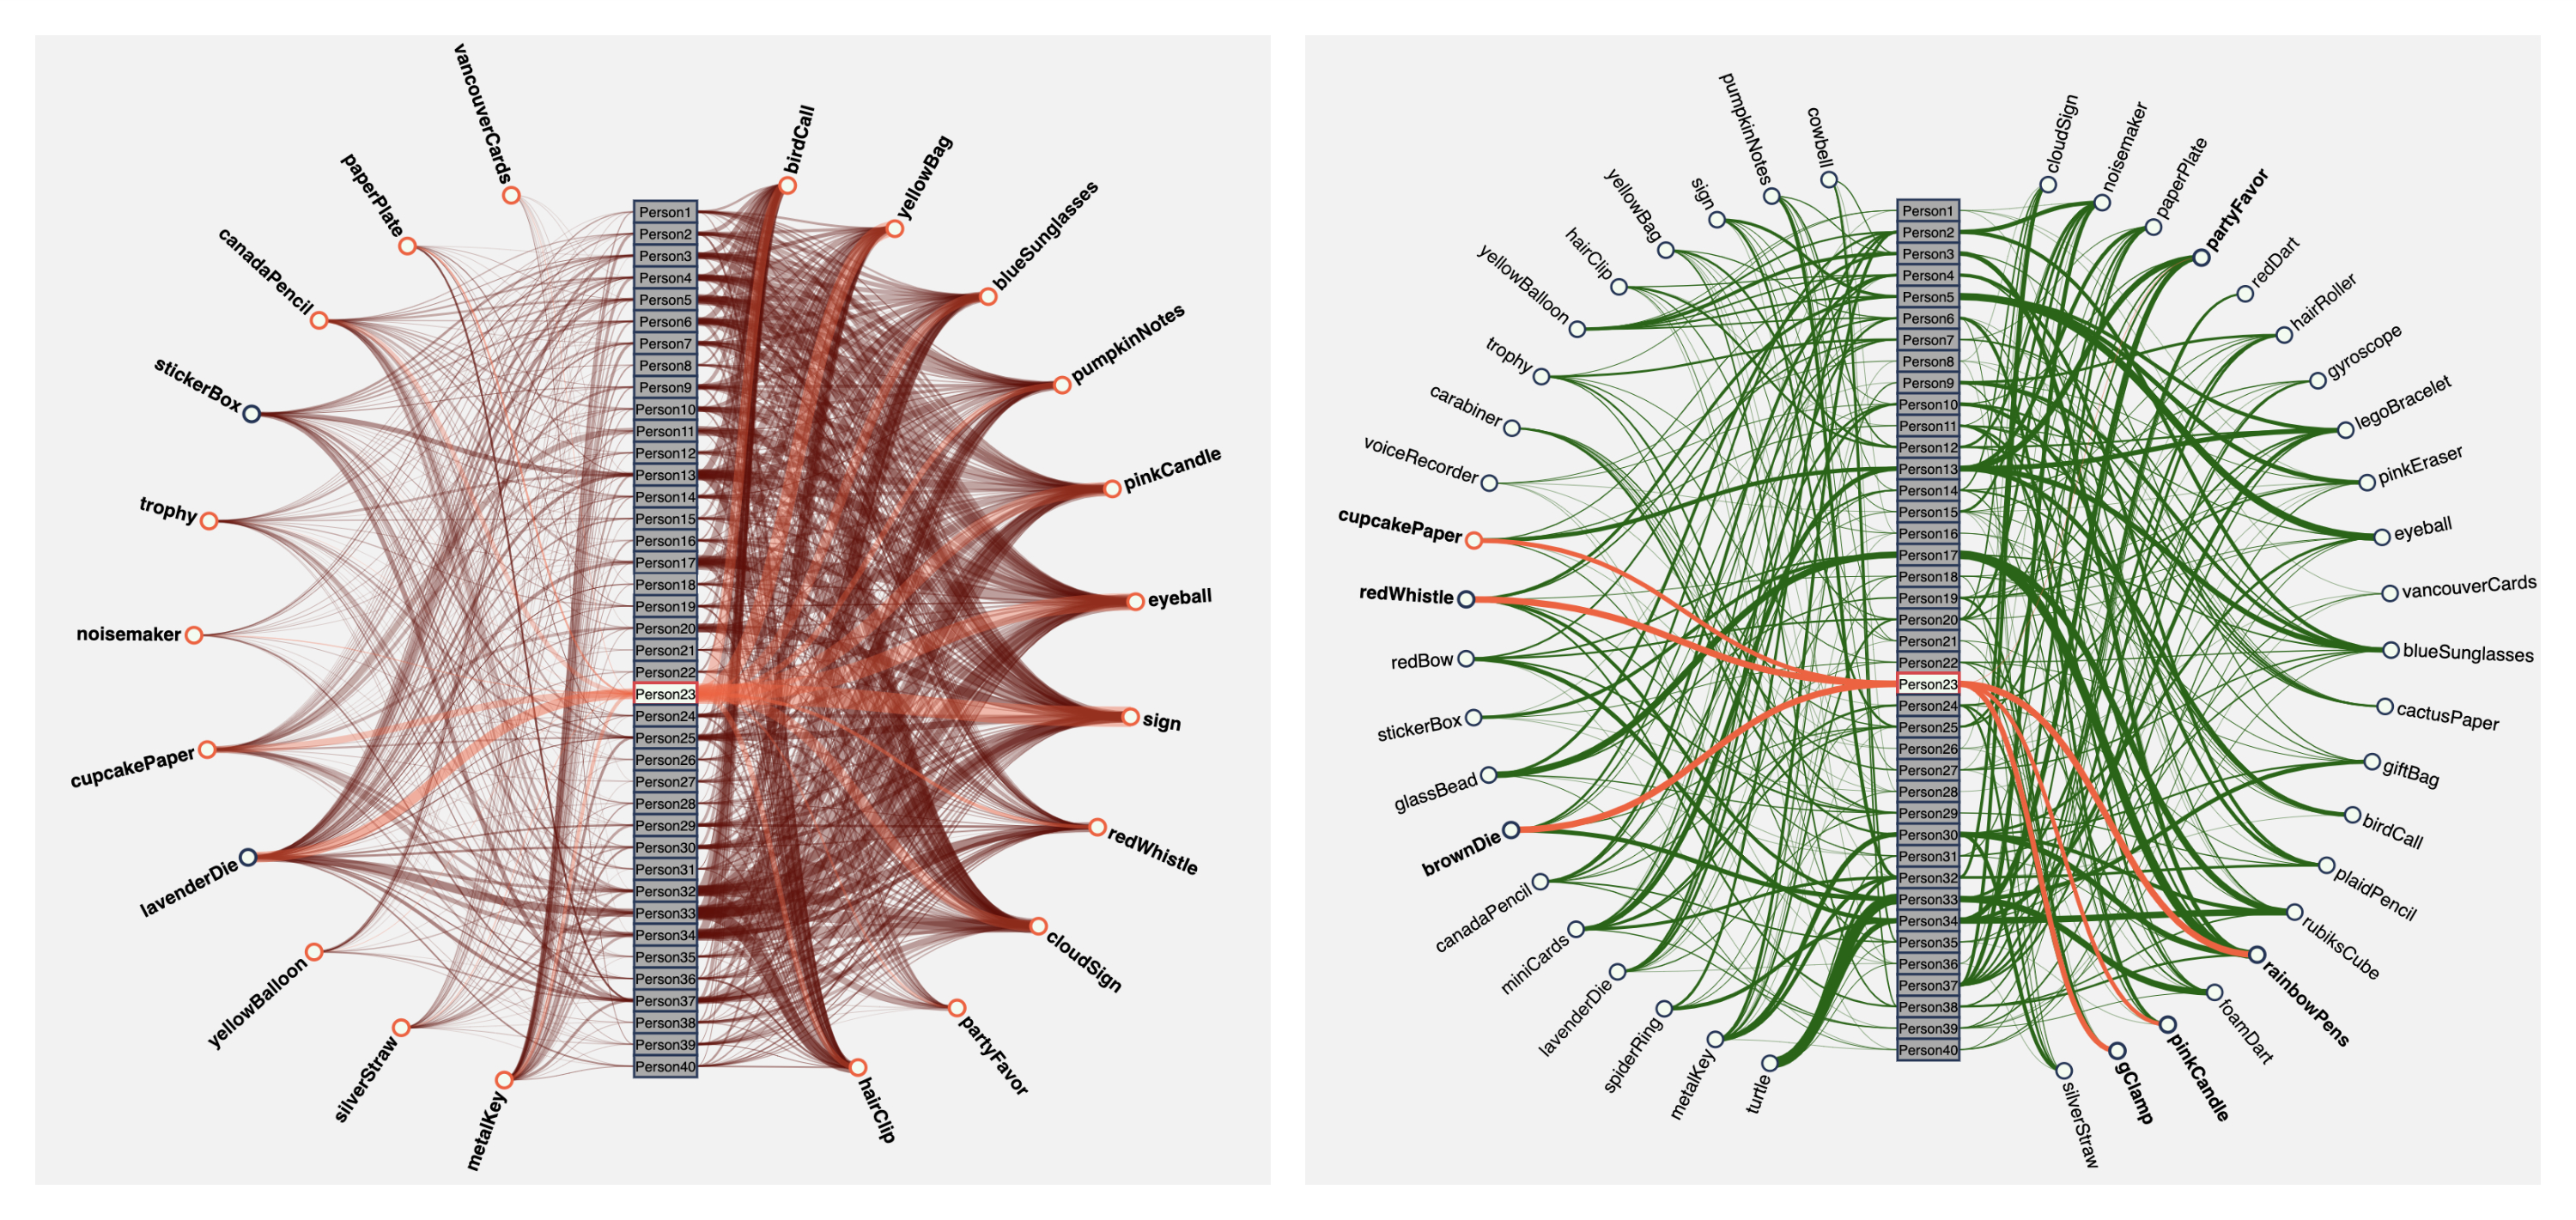
Figure 13
Person 23 is also predicted to have 20 objects, but actually he/she only has 6 objects. It can be indicated that the model given did not predict very well.
A matrix was developed to visualize the distribution of objects in the given data and corrected data. The brown points represent the original data with the opacity determined by the average of confidence scores for the object detected in a person's images, and the size of the circle depending on the number of occurrences the object was detected. The green squares represent the corrected data where the square size is calculated based on the number of occurrences an object appeared in a person's images.
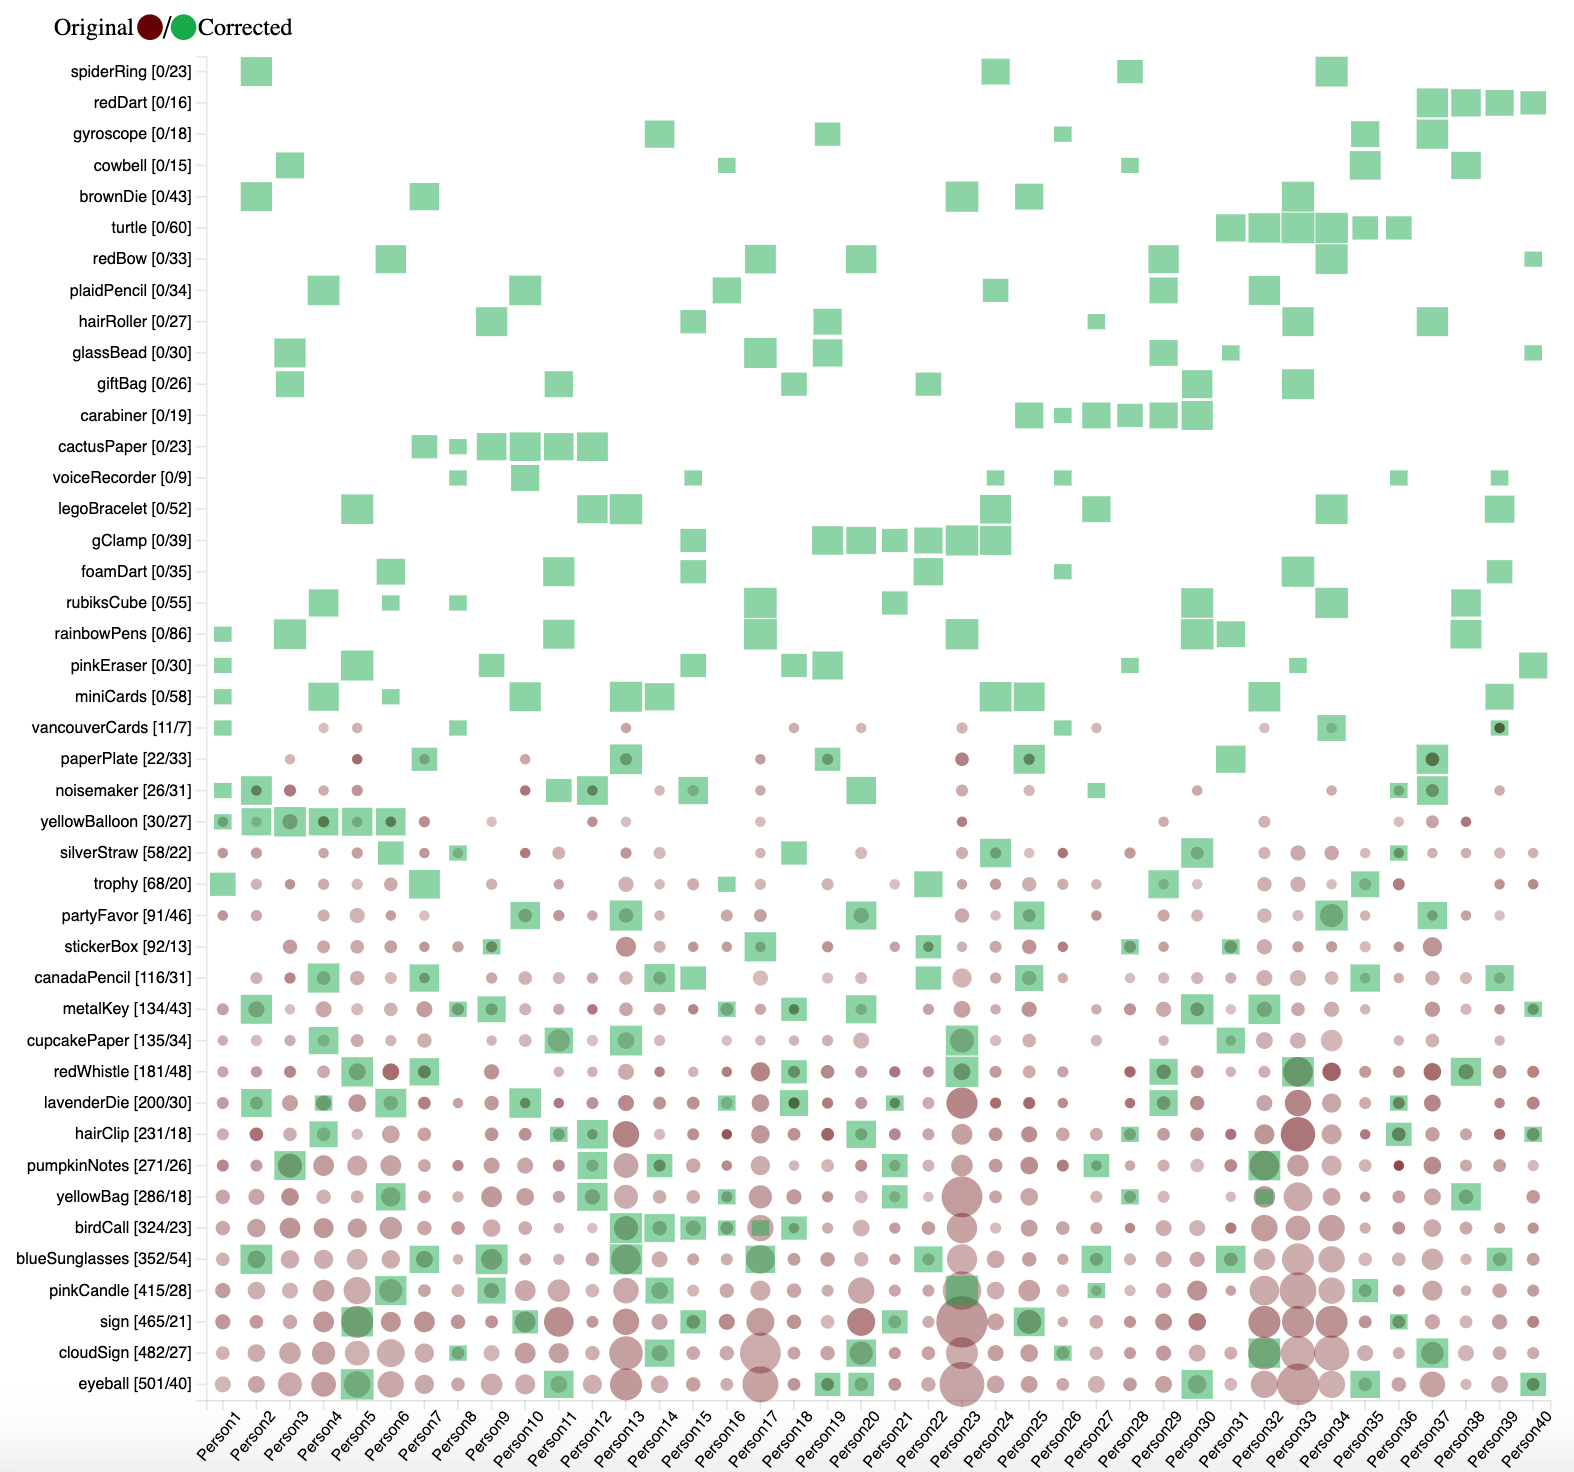
Figure 14: Object distribution matrix.
In the original data, there were many occurrences of the canadaPencil, but when comparing that to the corrected data only 8 people actually had images containing the canadaPencil.
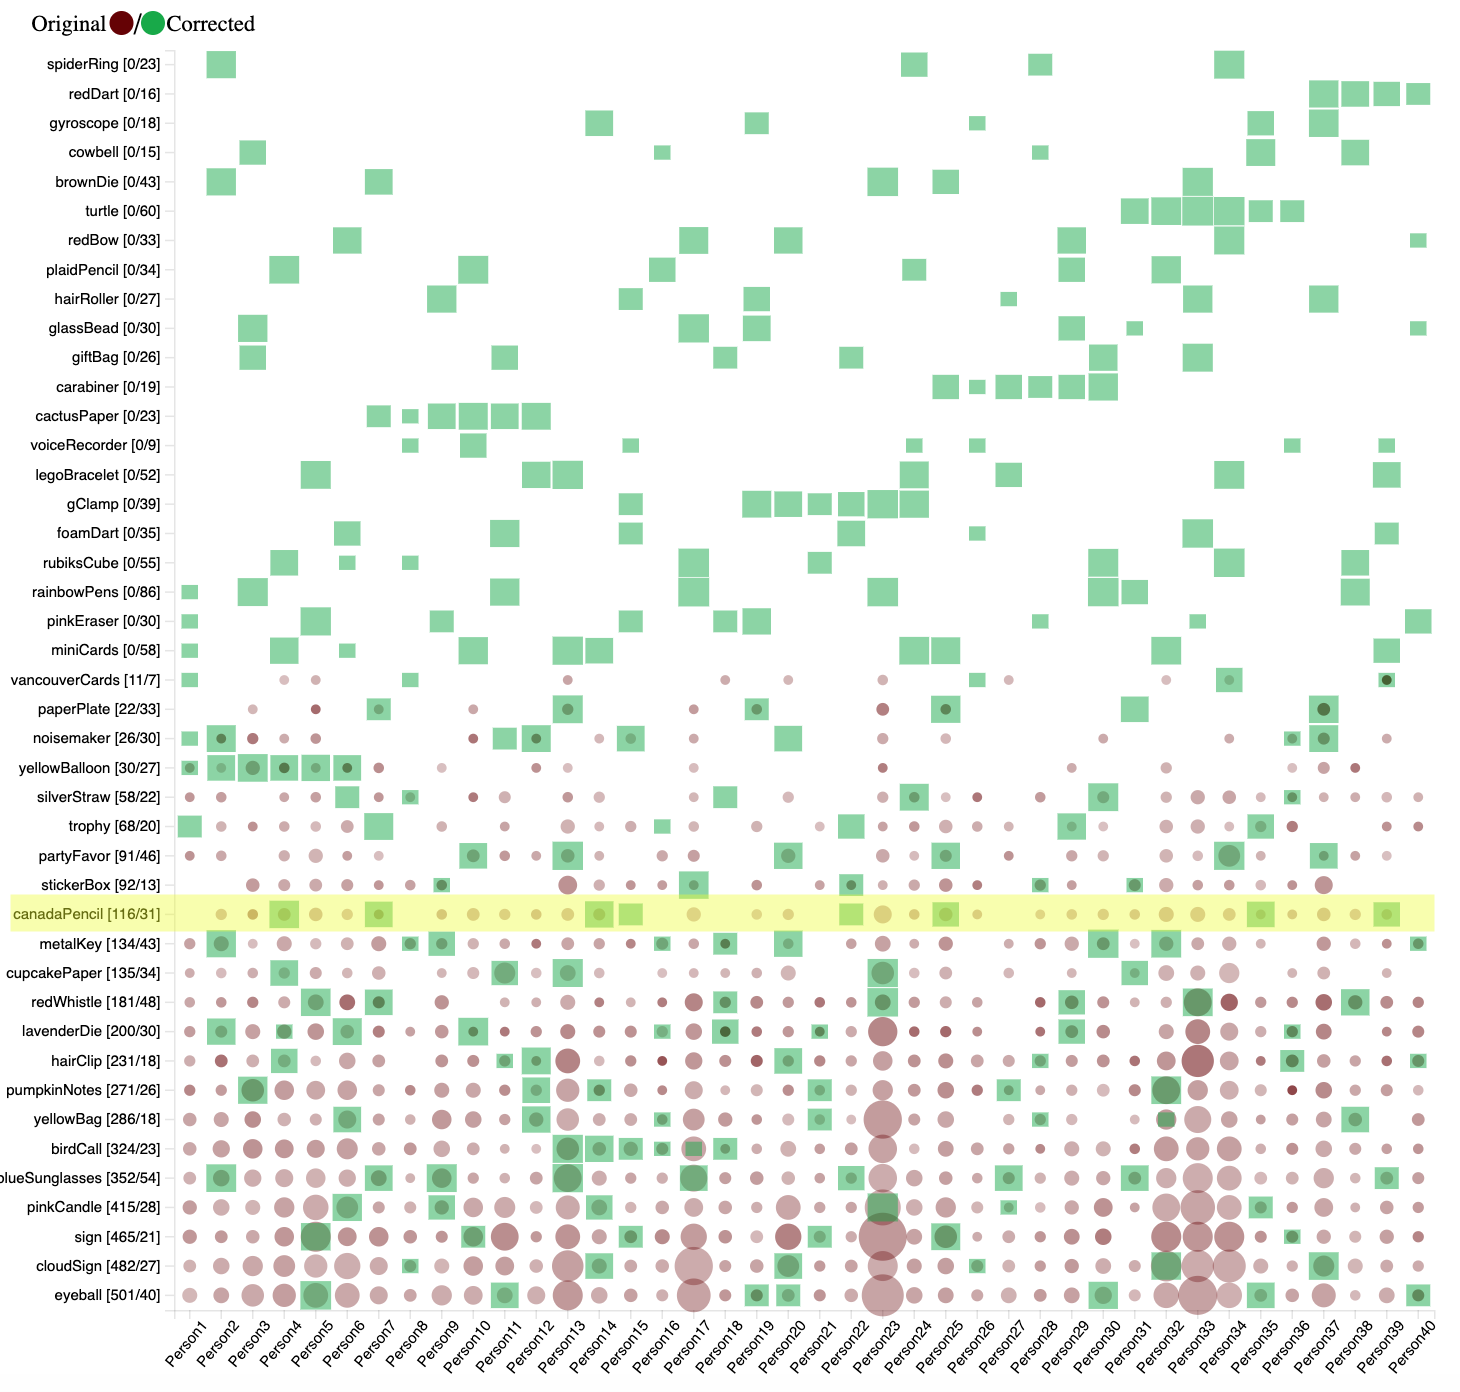
Figure 15: CanadaPencil object distribution.
Using the matrix visualization to analyze the corrected results, there are some patterns that emerge from the data. For example we can see groups of people in the list have similar objects based on where that person is in the list. For example only people 1-6 have images that contain the yellowBalloon.
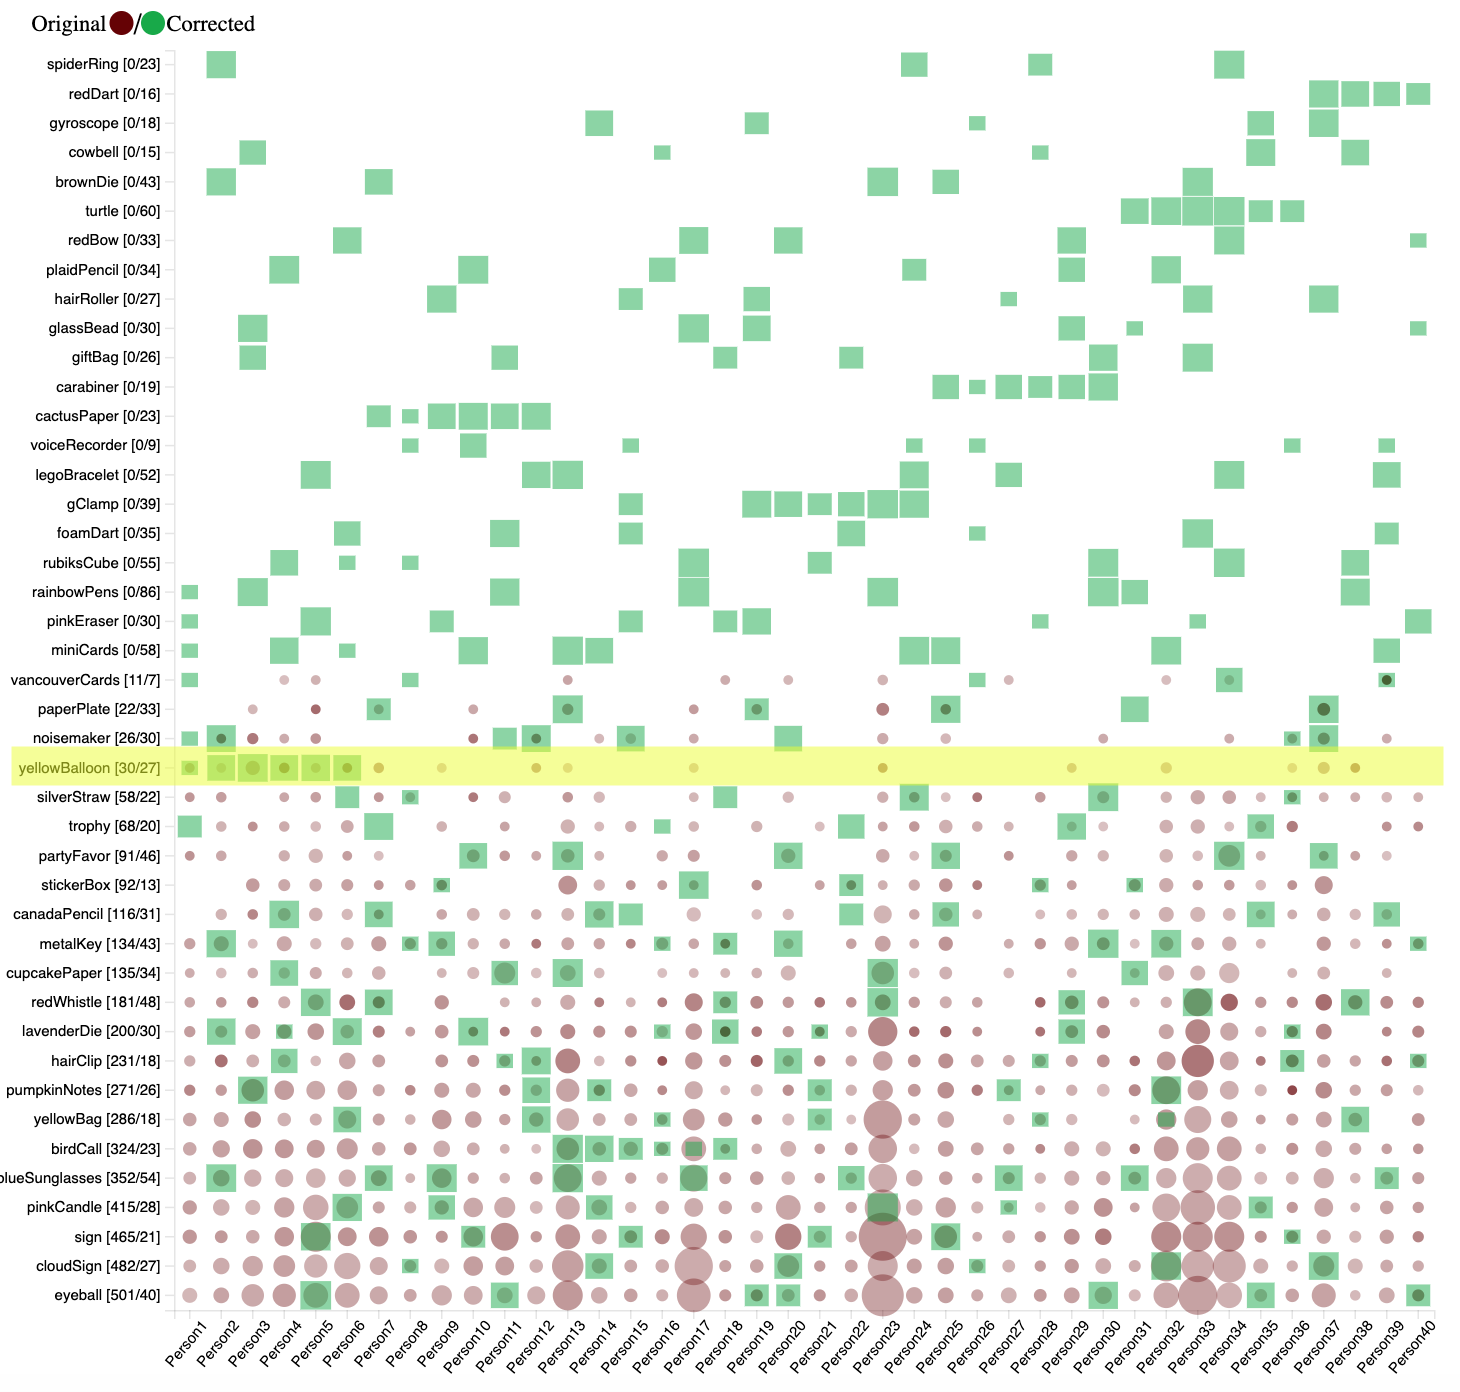
Figure 16: Yellow balloon object distribution.
Similarly for the cactusPaper object, only person7-12 have images that contain the object.

Figure 17: CactusPaper object distribution.
For the turtle with people31-36.

Figure 18: Turtle object distribution.
And for the redDart with person37-40.

Figure 19: RedDart object distribution.
In the next image with the corrected data, we can see that the group containing images with the canadaPencil also have images with other objects like the brownDie, blueSunglasses, miniCards, and trophy that some of the members of this group also share.

Figure 20: Network of People (Blue nodes) and Images (Yellow nodes).
Given the description that 8 individuals are responsible for the cyber event, we aim to find objects that are shared among 8 or more people. By examining the ground truth network, we have found that 9 objects (shared by at least 8 persons) are likely to be the totem:
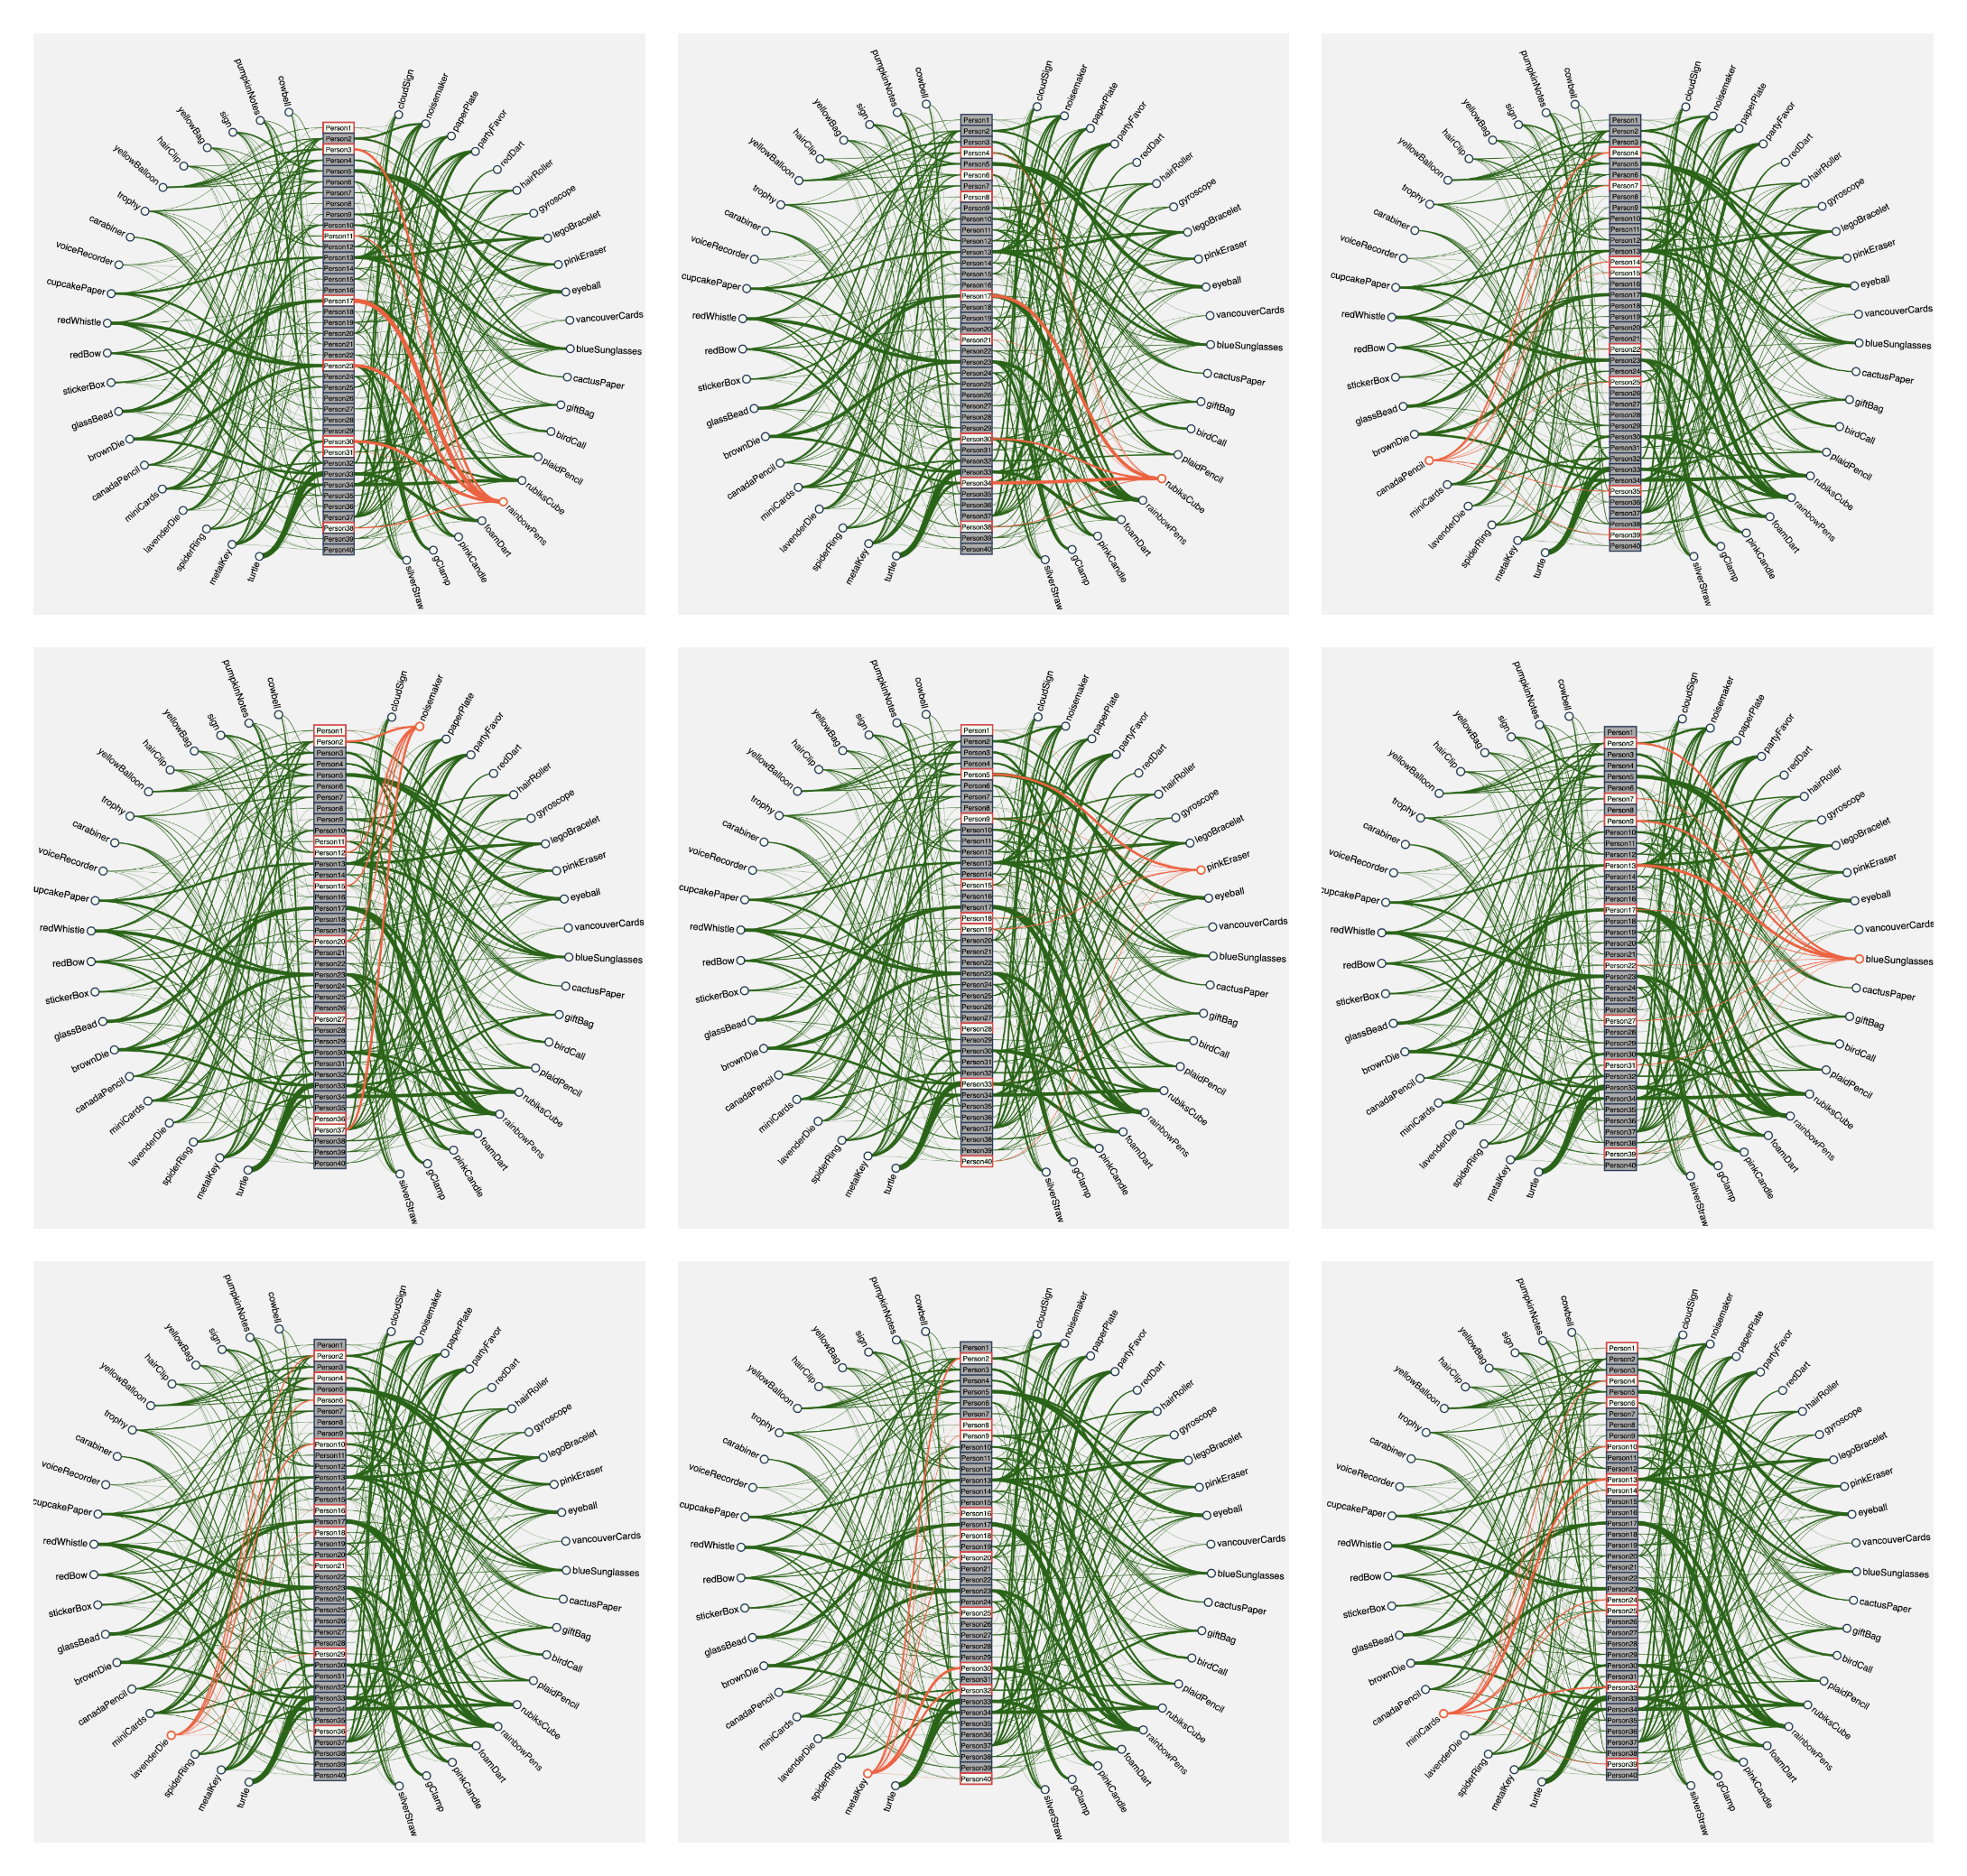
Figure 21
Objects shared among 8 people and their IDs:
- rainbowPens: 1, 3, 11, 17, 23, 30, 31, 38;
- rubicsCube: 4, 6, 8, 17, 21, 30, 34, 38;
- canadaPencil: 4, 7, 14, 15, 22, 25, 35, 39;
Objects shared among 9 people and their IDs:
- noiseMaker: 1, 2, 11, 12, 15, 20, 27, 36, 37;
- pinkEraser: 1, 5, 9, 15, 18, 19, 28, 33, 40;
- blueSunglasses: 2, 7, 9, 13, 17, 22, 27, 31, 39;
- lavenderDie: 2, 4, 6, 10, 16, 18, 21, 29, 36;
Objects shared among 10 people and their IDs:
- metalKey: 2, 8, 9, 16, 18, 20, 25, 30, 32, 40;
- miniCards: 1, 4, 6, 10, 13, 14, 24, 25, 32, 39.
We filtered our matrix to focus on these 9 objects. The number on top of each green box show how many time an object has been shared by a person. Only two last rows (blueSunglasses and canadianPencil) have more than 2 corrected appearances on all 8 related persons.
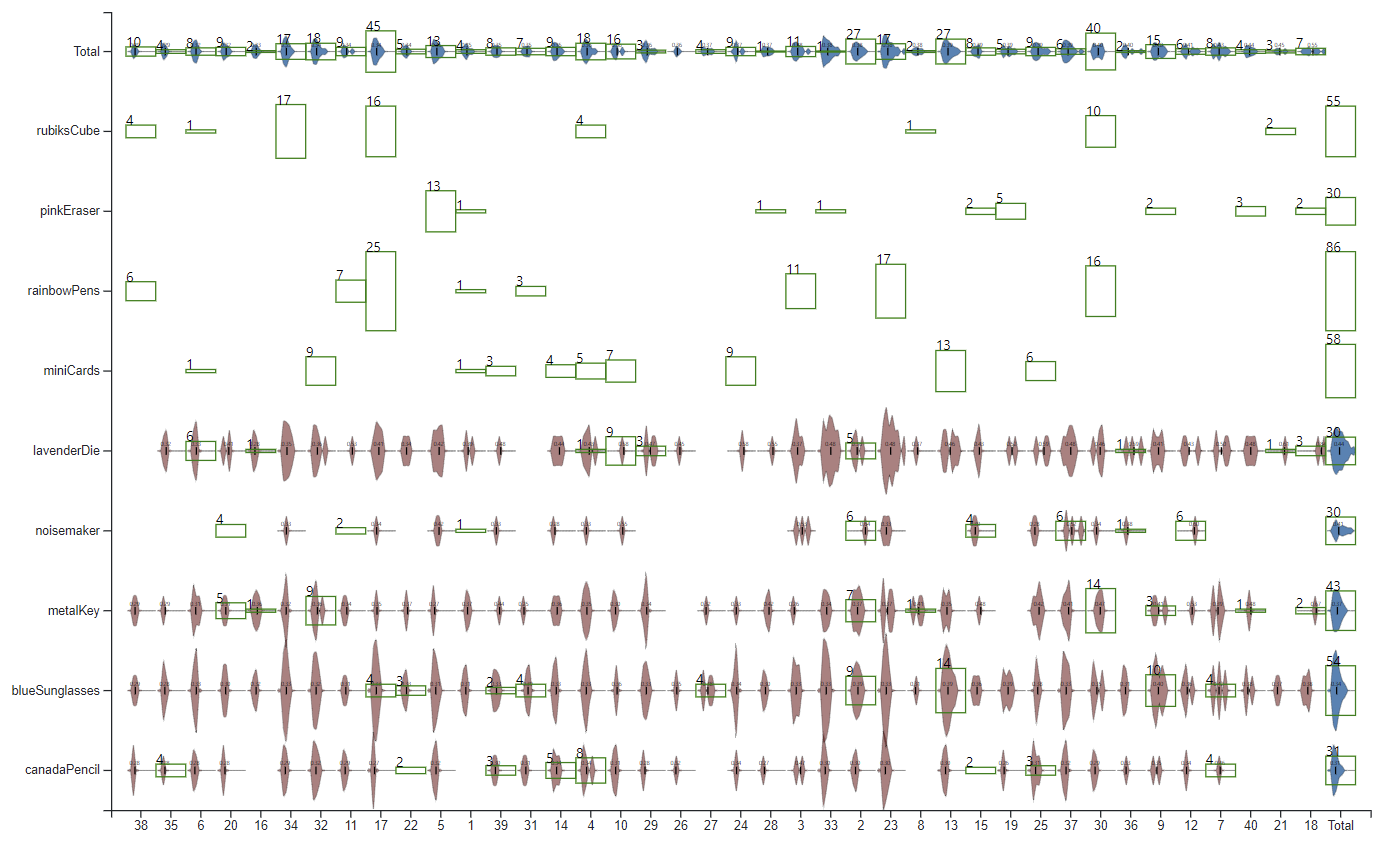
Figure 22
We concluded the group that includes people 4, 7, 14, 15, 22, 25, 35, 39 who all share the canadaPencil object is the group with the "totem". In the original data the canadaPencil is an object that does not have a high accuracy rate with the provided object detection model, and thus makes the identification of the group with this object more difficult.
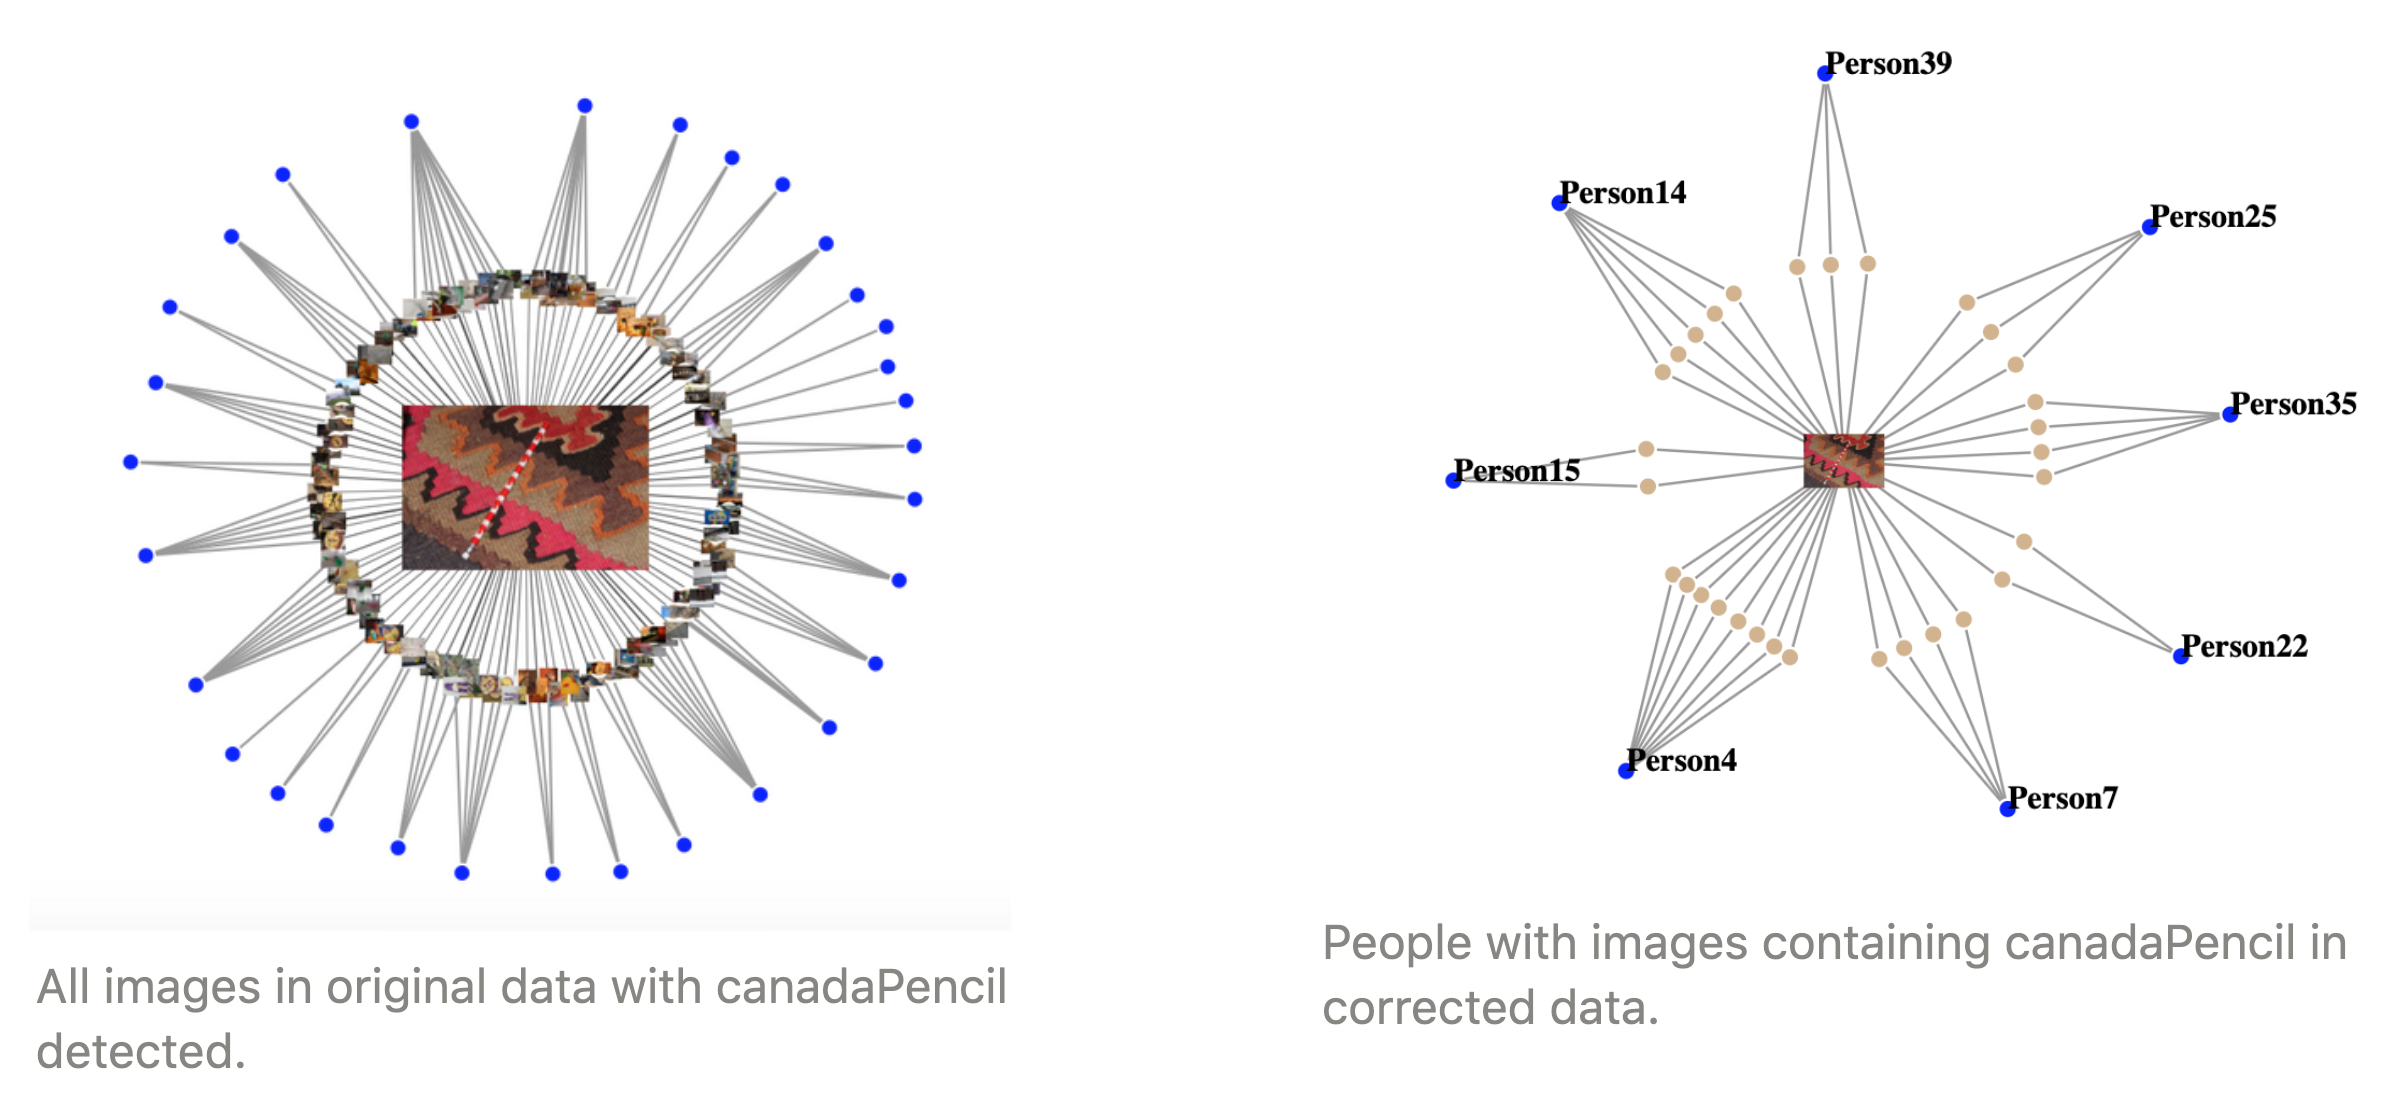
Figure 23
Also when looking at the corrected results, we can see that there are also other objects that connect these group members together even though they might not all share that object. There were 31 total people found to have the canadaPencil with the results provided. When comparing this to the corrected data, we can see that out of that 31 people only 6 people had images containing that object. There were also 2 other group members that were said to not have the canadaPencil in any images in the provided results.

Figure 24: Network of all people who are connected through canadaPencil object.
This image is a subgraph of all of the objects that were found in the images of people who shared the canadaPencil and shows what other objects connect the group members to each other. This image shows the 4 most popular objects that the group with the canadaPencil shared. And how they form a connection with the other members of the group.
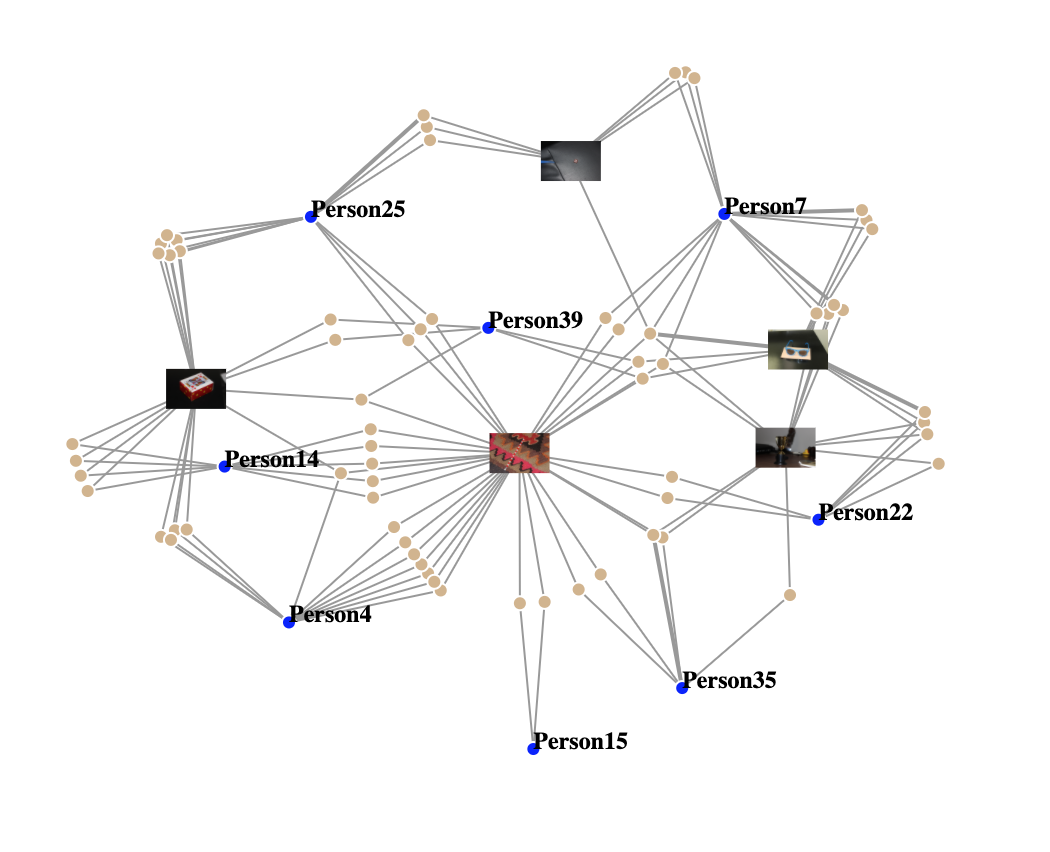
Figure 25: Network of top objects found with people who also have canadaPencil. .
The group that CGCS is seeking is a subgroup of 8 people. There are 4 that owned by only 8 people: canadaPencil, rainbowPens, noisemaker and rubiksCube. During the communication via images in that group, each person should have at least 2 images, representing sending-receiving signals. Among those 4 objects, only canadaPencil owners have 2 or more images per person, while the rest includes owners have 1 image.
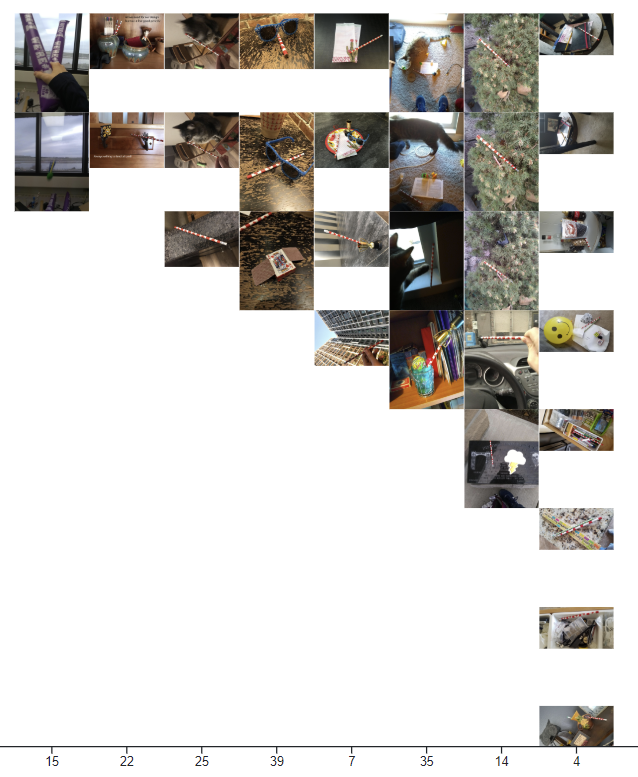
Figure 26: Actual images from the 8 persons contain the canadaPencil in the corrected classifications.
We use the object recognition model results provided and the ground truth resulted from the correction process. We select this direction because we can gather perspective from the prediction model — to track governance and present the machine learning model result, as well as having the correct standard — for any comparison and evaluation on the predicted data.
The biggest challenge we faced is the low accuracy of the predicted model. When looking at Person33's results, it can be seen that only the red whistle was correctly detected in the images. All other objects detected in the person's images did not appear in the corrected data set. Likewise, the redWhistle was the only object in the corrected dataset that also appeared in the results provided.
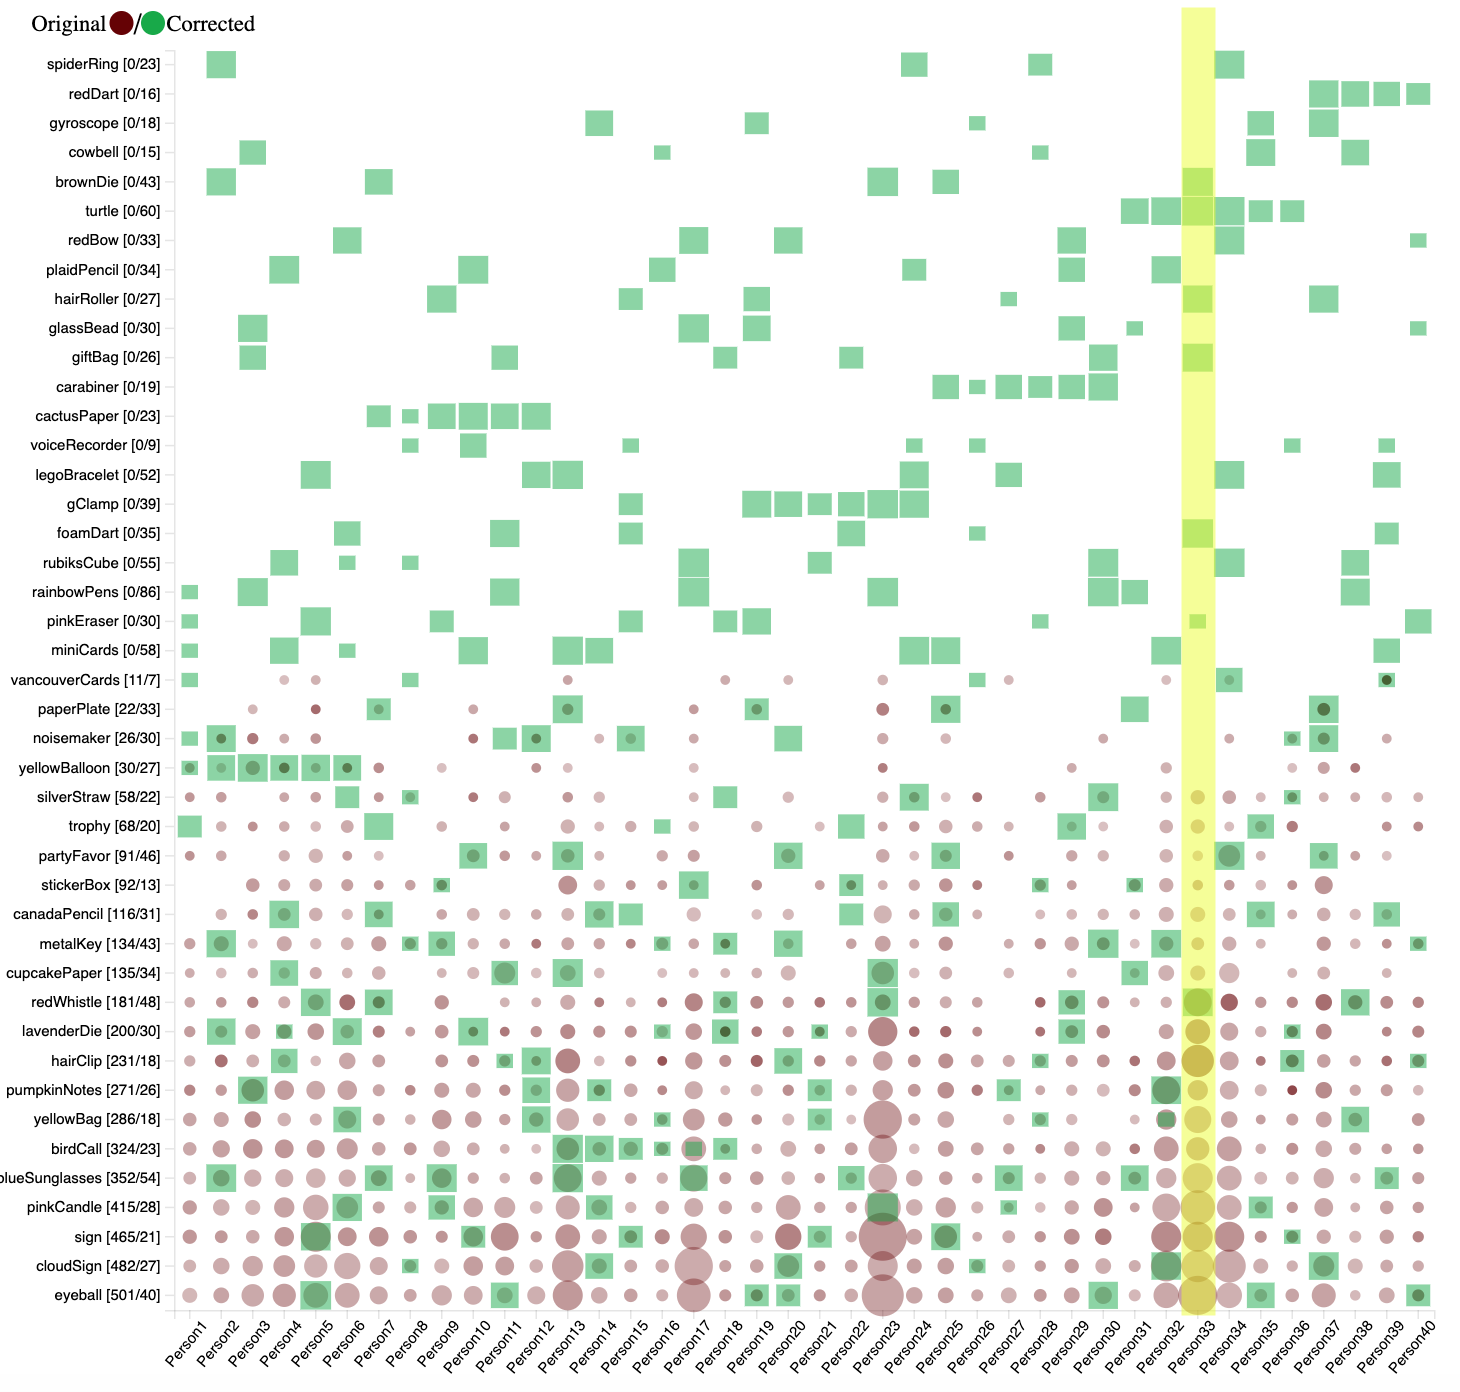
Figure 27: Classification discrepancy of Person33's original and corrected data .